

doi: 10.1186/gb-2003-4-5-r34.
Epub 2003 Apr 25.
Clustering gene-expression data with repeated measurements
Affiliations
- PMID: 12734014
- PMCID: PMC156590
- DOI: 10.1186/gb-2003-4-5-r34
Item in Clipboard
Clustering gene-expression data with repeated measurements
Genome Biol.
2003.
Abstract
Clustering is a common methodology for the analysis of array data, and many research laboratories are generating array data with repeated measurements. We evaluated several clustering algorithms that incorporate repeated measurements, and show that algorithms that take advantage of repeated measurements yield more accurate and more stable clusters. In particular, we show that the infinite mixture model-based approach with a built-in error model produces superior results.
Figures

Expression profiles of the classes in typical completely synthetic datasets with four repeated measurements. (a) Low noise level; (b) high noise level. For each class, the log ratios are plotted against the experiment numbers, and each class is shown in a different color. There are four sine (periodic) classes with different phase shifts and two linear (non-periodic) classes. Only four (out of six) classes are shown in (b) for clarity.
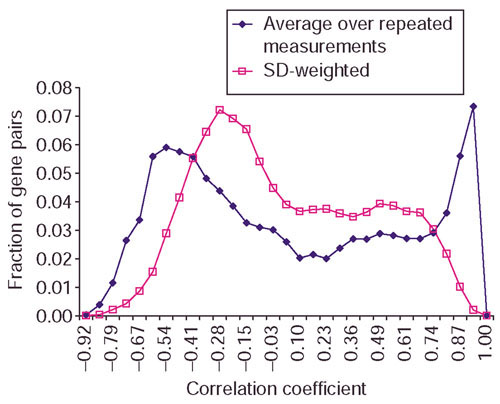
Distribution of the fraction of gene pairs against correlation coefficient. Correlation coefficients are computed from averaging over repeated measurements and using SD over repeated measurements as weights on the yeast galactose data. There are more gene pairs with correlation coefficients around 0 and fewer gene pairs with correlation coefficients near 1 when SD-weighted correlation is used.

Distribution of the fraction of gene pairs against Euclidean distance. Euclidean distances are computed from averaging over repeated measurements and using SD over repeated measurements as weights on the yeast galactose data. There are more gene pairs with Euclidean distances near 0 when SD-weighted distance is used.

Distribution of error plotted against intensity. The SDs over the log ratios from repeated measurements are plotted against the average intensities over repeated measurements in a typical experiment on the yeast galactose data.
References
-
- Hughes TR, Marton MJ, Jones AR, Roberts CJ, Stoughton R, Armour CD, Bennett HA, Coffey E, Dai H, He YD, et al. Functional discovery via a compendium of expression profiles. Cell. 2000;102:109–126. - PubMed
-
- Golub TR, Slonim DK, Tamayo P, Huard C, Gaasenbeek M, Mesirov JP, Coller H, Loh ML, Downing JR, Caligiuri MA, et al. Molecular classification of cancer: class discovery and class prediction by gene expression monitoring. Science. 1999;286:531–537. - PubMed
-
- van't Veer LJ, Dai H, van de Vijver MJ, He YD, Hart AA, Mao M, Peterse HL, van der Kooy K, Marton MJ, Witteveen AT, et al. Gene expression profiling predicts clinical outcome of breast cancer. Nature. 2002;415:530–536. - PubMed
-
- Hartigan JA. Clustering Algorithms. New York: John Wiley and Sons; 1975.
Publication types
MeSH terms
Substances
Grants and funding
LinkOut - more resources
Full Text Sources
Other Literature Sources
Molecular Biology Databases
