

Applications of competitor RNA in diagnostic reverse transcription-PCR
- PMID: 12734248
- PMCID: PMC154720
- DOI: 10.1128/JCM.41.5.2055-2061.2003
Applications of competitor RNA in diagnostic reverse transcription-PCR
Abstract
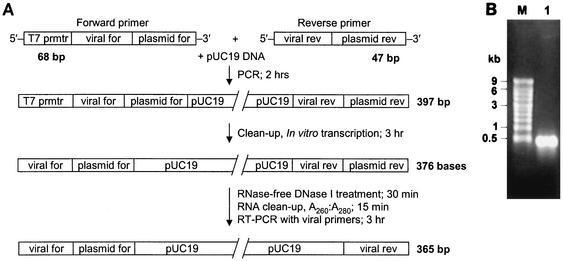
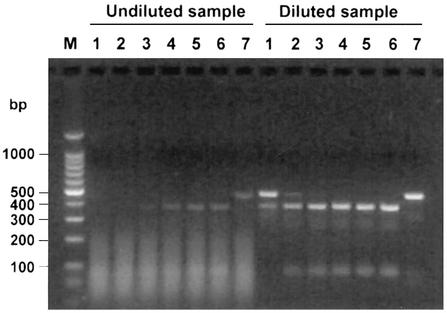
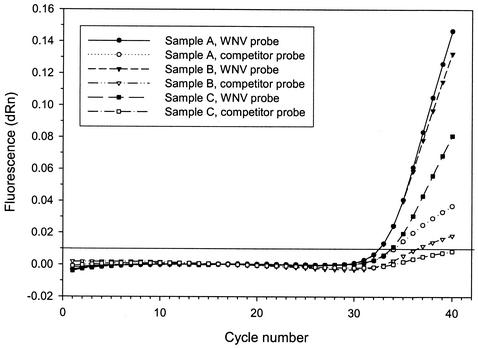
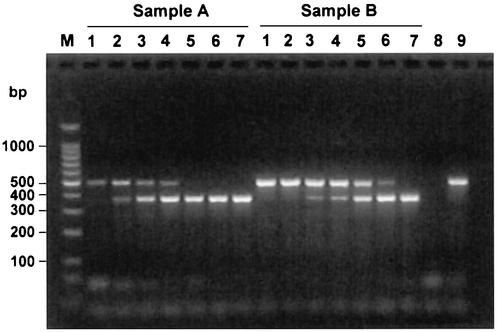
Detection of RNA viruses by reverse transcription (RT)-PCR has proven to be a useful approach for the diagnosis of infections caused by many viral pathogens. However, adequate controls are required for each step of the RT-PCR protocol to ensure the accuracies of diagnostic test results. Heterologous competitor RNA can be used as a control for a number of different aspects of diagnostic RT-PCR. Competitor RNA can be applied to assessments of the efficiency of RNA recovery during extraction procedures, detection of endogenous RT-PCR inhibitors that could lead to false-negative results, and quantification of viral template in samples used for diagnosis; competitor RNA can also be used as a positive control for the RT-PCR. In the present study, heterologous competitor RNA was synthesized by a method that uses two long oligonucleotide primers containing primer binding sites for RT-PCR amplification of porcine reproductive and respiratory syndrome virus or West Nile virus. Amplification of the competitor RNA by RT-PCR resulted in a product that was easily distinguished from the amplification product of viral RNA by agarose gel electrophoresis. Assessment of a variety of RNA samples prepared from routine submissions to a veterinary diagnostic laboratory found that either partial or complete inhibition of the RT-PCR could be demonstrated for approximately 20% of the samples. When inhibition was detected, either dilution of the sample or RNA extraction by an alternative protocol proved successful in eliminating the source of inhibition.
Figures
Similar articles
-
High risk of false positive results in a widely used diagnostic test for detection of the porcine reproductive and respiratory syndrome virus (PRRSV).Vet Microbiol. 2006 Jun 15;115(1-3):21-31. doi: 10.1016/j.vetmic.2006.01.001. Epub 2006 Feb 3. Vet Microbiol. 2006. PMID: 16458457
-
Highly sensitive TaqMan RT-PCR assay for detection and quantification of both lineages of West Nile virus RNA.J Clin Virol. 2006 Jul;36(3):177-82. doi: 10.1016/j.jcv.2006.02.008. Epub 2006 May 3. J Clin Virol. 2006. PMID: 16675298
-
Molecular detection and characterization of West Nile virus associated with multifocal retinitis in patients from southern India.Int J Infect Dis. 2012 Jan;16(1):e53-9. doi: 10.1016/j.ijid.2011.09.020. Epub 2011 Nov 17. Int J Infect Dis. 2012. PMID: 22099888
-
High-throughput detection of West Nile virus RNA.J Clin Microbiol. 2001 Apr;39(4):1264-71. doi: 10.1128/JCM.39.4.1264-1271.2001. J Clin Microbiol. 2001. PMID: 11283039 Free PMC article.
-
Use of an internal positive control in a multiplex reverse transcription-PCR to detect West Nile virus RNA in mosquito pools.J Clin Microbiol. 2004 Feb;42(2):841-3. doi: 10.1128/JCM.42.2.841-843.2004. J Clin Microbiol. 2004. PMID: 14766868 Free PMC article.
Cited by
-
Rapid one-step quantitative reverse transcriptase PCR assay with competitive internal positive control for detection of enteroviruses in environmental samples.Appl Environ Microbiol. 2006 Jun;72(6):3960-7. doi: 10.1128/AEM.02291-05. Appl Environ Microbiol. 2006. PMID: 16751503 Free PMC article.
-
Detection of foot and mouth disease and porcine reproductive and respiratory syndrome viral genes using microarray chip.Vet Res Commun. 2006 Feb;30(2):191-204. doi: 10.1007/s11259-006-3193-8. Vet Res Commun. 2006. PMID: 16400604
-
A SYBR Green RT-PCR assay in single tube to detect human and bovine noroviruses and control for inhibition.Virol J. 2008 Aug 14;5:94. doi: 10.1186/1743-422X-5-94. Virol J. 2008. PMID: 18702817 Free PMC article.
-
Porcine arterivirus activates the NF-kappaB pathway through IkappaB degradation.Virology. 2005 Nov 10;342(1):47-59. doi: 10.1016/j.virol.2005.07.034. Epub 2005 Aug 29. Virology. 2005. PMID: 16129468 Free PMC article.
-
Development of an internal positive control for rapid diagnosis of avian influenza virus infections by real-time reverse transcription-PCR with lyophilized reagents.J Clin Microbiol. 2006 Sep;44(9):3065-73. doi: 10.1128/JCM.00639-06. J Clin Microbiol. 2006. PMID: 16954228 Free PMC article.
References
-
- Akane, A., K. Matsubara, H. Nakamura, S. Takahashi, and K. Kimura. 1994. Identification of the heme compound copurified with deoxyribonucleic acid (DNA) from blood stains, a major inhibitor of polymerase chain reaction (PCR) amplification. J. Forensic Sci. 39:362-372. - PubMed
-
- Ballagi-Pordany, A., and S. Belak. 1996. The use of mimics as internal controls to avoid false negatives in diagnostic PCR. Mol. Cell. Probes 10:159-164. - PubMed
-
- Borriello, F., and J. Lederer. 1995. Construction of quantitative RT-PCR mimics. BioTechniques 19:580-584. - PubMed
-
- Da Silva, N., R. Zardoya, G. Santurde, A. Solana, and J. M. Castro. 1995. Rapid and sensitive detection of the bovine viral diarrhea virus genome in semen. J. Virol. Methods 55:209-218. - PubMed
-
- Dyer, J. R., B. L. Gilliam, J. J. Eron, L. Grosso, M. S. Cohen, and S. A. Fiscus. 1996. Quantitation of human immunodeficiency virus type 1 RNA in cell free seminal plasma: comparison of NASBA and Amplicor reverse transcription-PCR amplification and correlation with quantitative culture. J. Virol. Methods 60:161-170. - PubMed
MeSH terms
Substances
LinkOut - more resources
Full Text Sources
Other Literature Sources
