. 2003 May 1;23(9):3658-68.
doi: 10.1523/JNEUROSCI.23-09-03658.2003.

The role of the hyperpolarization-activated cationic current I(h) in the timing of interictal bursts in the neonatal hippocampus

Affiliations

The role of the hyperpolarization-activated cationic current I(h) in the timing of interictal bursts in the neonatal hippocampus

Ariel Agmon et al. J Neurosci. .

Abstract

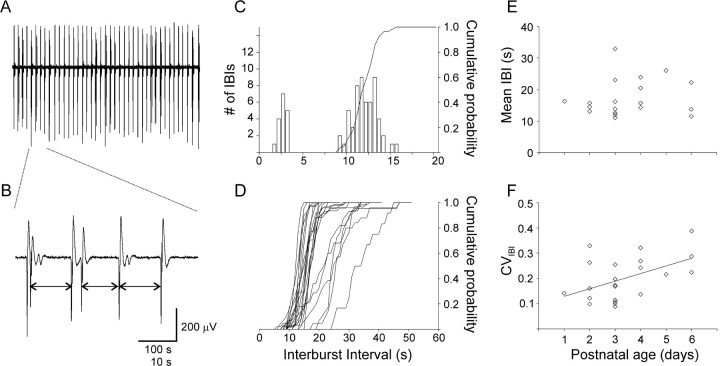
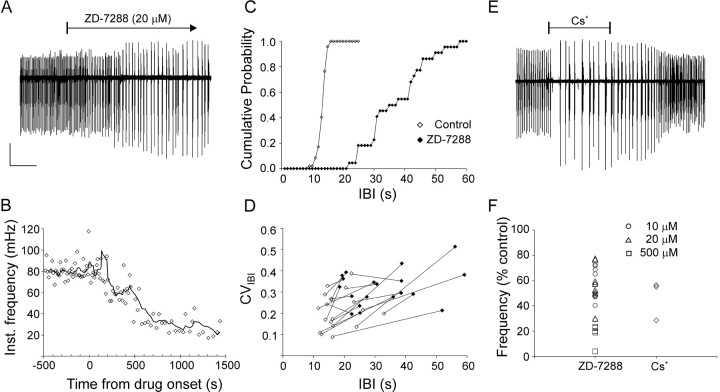
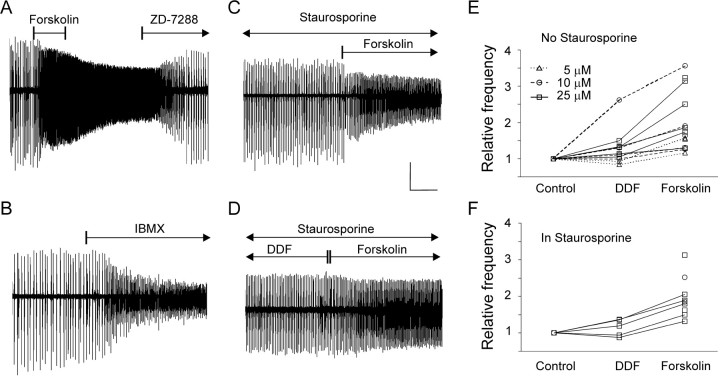
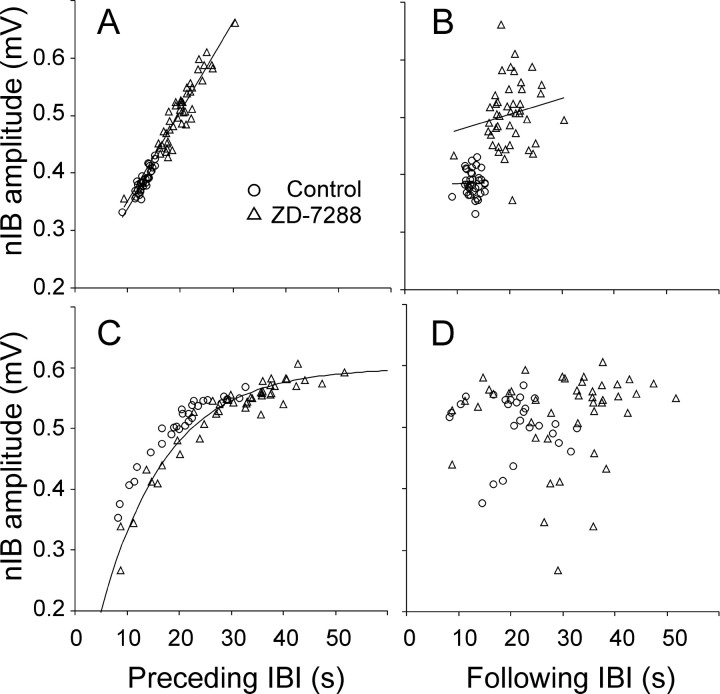
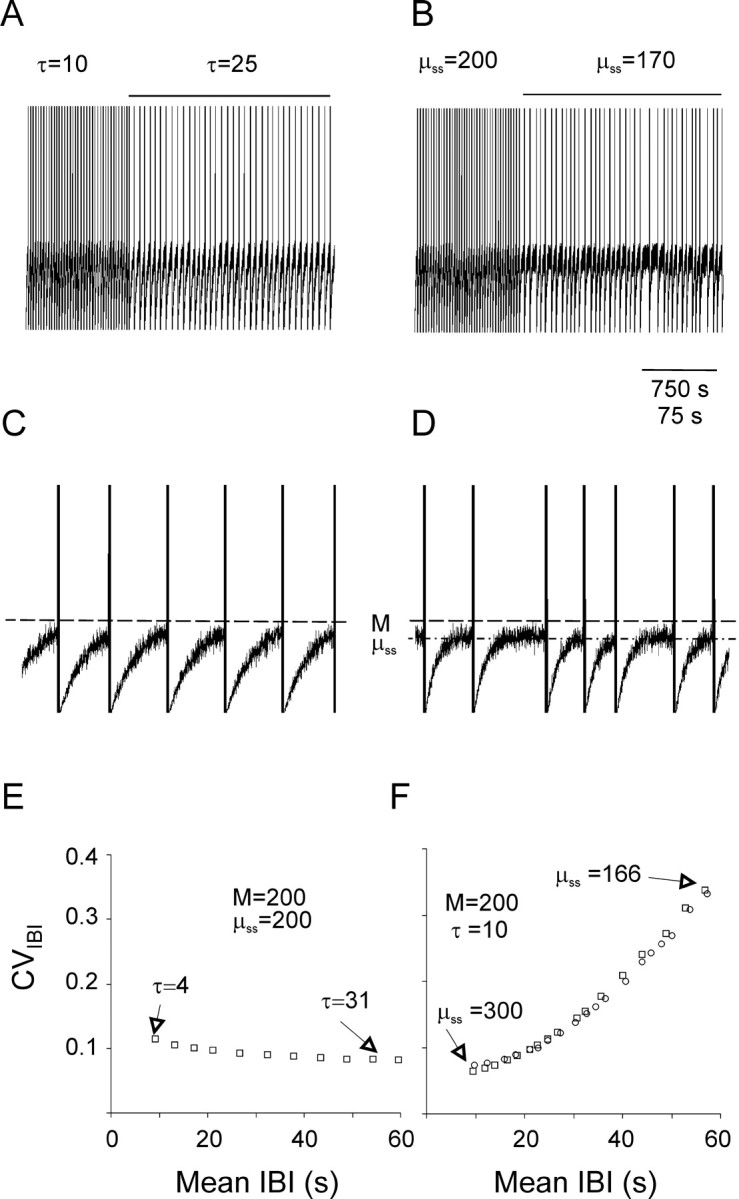
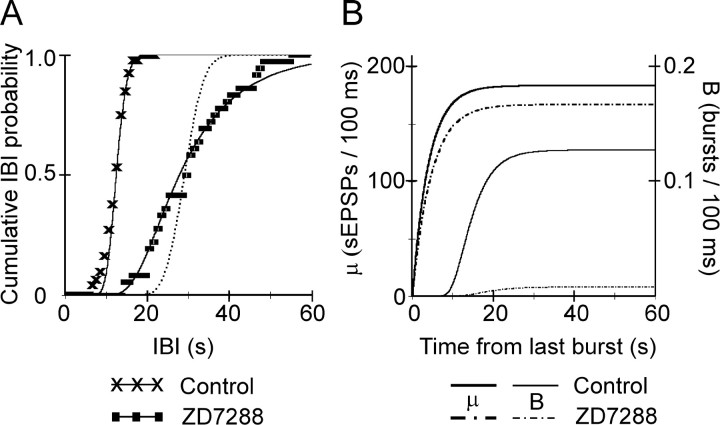
Under both pathological and experimental conditions, area CA3 of the adult or juvenile hippocampus generates periodic population discharges known as interictal bursts. Whereas the ionic and synaptic basis of individual bursts has been comprehensively studied experimentally and computationally, the pacemaker mechanisms underlying interictal rhythmicity remain conjectural. We showed previously that rhythmic population discharges resembling interictal bursts can be induced in hippocampal slices from first postnatal week mice, in Mg2+-free solution with GABA(A) receptor-mediated inhibition blocked. Here we show that these neonatal bursts occurred with high temporal precision and that their frequency and regularity were greatly reduced by the bradycardic agent ZD-7288 when applied at concentrations and durations that selectively block the hyperpolarization-activated, cationic current I(h). Augmenting I(h) by elevating intracellular cAMP dramatically increased burst frequency in a protein kinase A-independent manner. Burst amplitudes were strongly correlated with the preceding, but not the following, interburst intervals. The experimentally observed distribution of interburst intervals was modeled by assuming that a burst was triggered whenever the instantaneous rate of spontaneous EPSPs (sEPSPs) exceeded a threshold and that the mean sEPSP rate was minimal immediately after a burst and then relaxed exponentially to a steady-state level. The effect of blocking I(h) in any given slice could be modeled by decreasing only the steady-state sEPSP rate, suggesting that the instantaneous rate of sEPSPs is governed by the level of I(h) activation and raising the novel possibility that interburst intervals reflected the slow activation kinetics of I(h) in the neonatal CA3.


Figures

Fig. 1.
Fig. 1.
A horizontal hippocampal slice from a P4 mouse, as visualized during the experiment. CA1, CA3, and dentate gyrus (DG) are indicated; typical recording position in CA3 stratum radiatum is indicated by the asterisk. Arrows denote lateral (L) and rostral (R) directions.
Fig. 2.
Fig. 2.
Neonatal IBs in area CA3 are highly regular. A, A 500-sec-long extracellular record from a P3 slice bathed in control ACSF (Mg2+-free, with 5 μm gabazine), illustrating the high regularity of nIBs.B, A segment expanded from the record inA, illustrating that intercluster intervals (two-sided arrows) but not intracluster intervals were included in the analysis in this study. C, The IBI histogram for the experiment ofA shows two well separated peaks; the peak below 5 sec consists of intracluster intervals, which were excluded in the calculation of the CIH (solid line). CVIBI for this experiment was 0.12. D, Superimposed CIHs from all 22 slices recorded in control ACSF. Note the tight clustering and steep slope of 16 CIHs on the left side of the plot, illustrating the pacemaker-like character of nIBs. E, The mean IBI of all slices showed no change with postnatal age. F, In contrast, the CVIBI increased significantly between P1 and P6 (note the regression line).
Fig. 3.
Fig. 3.
Blocking Ih strongly reduced nIB frequency and regularity. A, BlockingIh with the specific blocker ZD-7288 caused a more than threefold reduction in nIB frequency, coupled to a pronounced increase in nIB amplitudes. B, The time course of decrease in nIB frequency for the experiment shown inA, plotted at the same time scale. Data points represent instantaneous frequency (1/previous IBI); solid line is a running average, calculated using a sliding window of five data points. Time 0 designates drug arrival in the recording chamber. C, The rightward shift and decreased slope of the CIH for the experiment ofA illustrates the drug-induced increase in the IBI and the CVIBI, respectively. CIHs were calculated using 1 sec bins. D, CVIBI plotted against mean IBI, with data points from the same slice before (open symbols) and after (filled symbols) adding ZD-7288 connected by lines. Note that, in the great majority of cases, the ZD-7288-induced increase in the mean IBI was coupled to a pronounced increase in the CVIBI.E, A reduction in nIB frequency of a similar magnitude to that induced by ZD-7288 was caused by the less specific (but reversible) Ih blocker Cs+ (2 mm). F, Summary of the percent reduction in nIB frequency attributable to ZD-7288 (see legend for concentrations) and Cs+ (2 mm) in all experiments. A andE are from different P3 animals. Calibration:A, 100 μV, 300 sec; E, 150 μV, 250 sec.
Fig. 4.
Fig. 4.
Increasing intracellular cAMP strongly accelerated nIB frequency in a PKA-independent manner. A, The adenylyl cyclase activator forskolin (25 μm) caused a threefold increase in nIB frequency and a concomitant decrease in amplitudes within minutes after application; theIh blocker ZD-7288 (20 μm) reversed this increase and further reduced the nIB frequency to 60% of its control value before forskolin application (P1 slice).B, Application of the phosphodiesterase inhibitor IBMX (200 μm) caused a 2.5-fold increase in nIB frequency and a concomitant reduction in amplitudes (P3 slice). C, Preincubation for >1 hr with the broad-spectrum protein kinase inhibitor staurosporine (100 nm) did not prevent forskolin (20 μm) from accelerating nIBs by 1.7-fold (P3 slice).D, In the presence of staurosporine, forskolin (25 μm) still caused a 1.5-fold increase in nIB frequency over the frequency in equimolar concentration of the analog DDF, which does not activate adenylyl cyclase (P5 slice). E, Summary plot of all slices tested in DDF and forskolin without staurosporine; data points not connected by lines are from slices tested only in forskolin. Symbols and lines are coded by drug concentration (legend). F, Summary plot as inE but for slices tested in the presence of 100 nm staurosporine. Calibration: A, 100 μV, 500 sec; B, 200 μV, 400 sec; C, 200 μV, 250 sec; D, 100 μV, 250 sec.
Fig. 5.
Fig. 5.
Amplitudes of nIBs were strongly correlated with the preceding but not the following interburst intervals. Illustrated data were recorded before (circles) and after (triangles) adding ZD-7288 to a P2 slice (A, B) and a P4 slice (C, D). In A andB, data points in control and in ZD-7288 were fitted separately with linear regression lines, illustrating a strong correlation in A(r2 = 0.80 andr2 = 0.87, respectively) but lack of correlation in B(r2 = 5 × 10⁻⁵ and r2= 0.03, respectively). Note that the two regression lines inA nearly coincide. In C, data points in ZD-7288 were fitted by a decaying exponential with an asymptote of 0.6 mV and a time constant of 12.5 sec; note that data points in control ACSF fall along nearly the same curve
Fig. 6.
Fig. 6.
A three-parameter computational model simulated the effect of ZD-7288 on nIB frequency and regularity.A–D, Simulated sequences of nIBs are plotted at a slow (A, B) and a 10-fold faster (C, D) time base. Simulated nIBs were generated by assuming that the mean instantaneous sEPSP rate (μ) is reset to 0 after each burst and then relaxes exponentially to an asymptote (μss) with a time constant τ. Fluctuations around μ were generated by a Poissonian random-number generator; each time a fluctuation crossed the thresholdM (dashed line in C andD), a burst was assumed to be triggered. InA and B, the initial part of the trace was computed using the values M = μss = 200 and τ = 10 sec; during the time indicated by the horizontal lines above the trace, either τ (A, C) or μss(B, D) were changed to the values indicated (μss is also indicated by the dashed-dotted line in D). The traces represent the value of μ, except that the occurrence of a burst is indicated by a vertical line of arbitrary height. Note that increasing τ (A,C) reduced the frequency of bursts without affecting their regularity, whereas reducing μss (B,D) affected both the frequency and the regularity of the bursts. E, The simulated CVIBI versus the simulated mean IBI, computed using the indicated values ofM and μss while varying the value of τ as indicated. Note that changing τ had very little effect on the CVIBI. F, The simulated CVIBIversus the simulated mean IBI, computed using the indicated values ofM and τ while varying μss as indicated (squares). Note that changing μss affected in parallel both the mean IBI and the CVIBI. Changing Mfrom 140 to 238 while keeping μss = 200 generated data points (circles) that fell along the same curve generated by changing μss while keeping Mconstant.
Fig. 7.
Fig. 7.
A change in μss, but not in τ, can account for the effect of ZD-7288 on nIB frequency and regularity. A, CIHs of experimental nIBs from a P6 slice in control ACSF (× symbols) was fitted by a curve (solid line) computed with the parameter values μss = 184 and τ = 4 sec. The effect of 20 μm ZD-7288 (squares) was well fitted (solid line) by reducing μss to 167.5, with only a minor increase in τ (to 4.6 sec). With μssunchanged, a 2.5-fold increase in τ (to 10.5 sec) was required to achieve the same rightward shift in the median IBI, but the resulting curve (dotted line) did not reproduce the pronounced decrease in the slope of the experimental CIH. Experimental CIHs were calculated in 1 sec bins. B, The value of the model parameter μ (lefty-axis) in control ACSF (heavy solid line) and in ZD-7288 (heavy dashed-dotted line), as a function of the time elapsed because the previous burst, for the same parameter values used inA. The relatively small reduction in μssrequired to simulate the effect of the drug caused a dramatic drop in the probability of burst occurrence per 100 msec (righty-axis) in ZD-7288 (light dashed-dotted line) compared with control ACSF (light solid line), because now fluctuations around μ only rarely crossed threshold (compare with Fig.6C,D).

References

    1. Akasu T, Shoji S, Hasuo H. Inward rectifier and low-threshold calcium currents contribute to the spontaneous firing mechanism in neurons of the rat suprachiasmatic nucleus. Pflügers Arch. 1993;425:109–116. - PubMed
    1. Alger BE, Pitler TA, Wagner JJ, Martin LA, Morishita W, Kirov SA, Lenz RA. Retrograde signalling in depolarization-induced suppression of inhibition in rat hippocampal CA1 cells. J Physiol (Lond) 1996;496:197–209. - PMC - PubMed
    1. Arvanov VL, Holmes KH, Keele NB, Shinnick-Gallagher P. The functional role of metabotropic glutamate receptors in epileptiform activity induced by 4-aminopyridine in the rat amygdala slice. Brain Res. 1995;669:140–144. - PubMed
    1. Avoli M, Barbarosie M, Lucke A, Nagao T, Lopantsev V, Kohling R. Synchronous GABA-mediated potentials and epileptiform discharges in the rat limbic system in vitro. J Neurosci. 1996;16:3912–3924. - PMC - PubMed
    1. Ayala GF, Dichter M, Gumnit RJ, Matsumoto H, Spencer WA. Genesis of epileptic interictal spikes. New knowledge of cortical feedback systems suggests a neurophysiological explanation of brief paroxysms. Brain Res. 1973;52:1–17. - PubMed

Publication types

MeSH terms