. 2003 May 1;23(9):3745-51.
doi: 10.1523/JNEUROSCI.23-09-03745.2003.

Intracranially administered anti-Abeta antibodies reduce beta-amyloid deposition by mechanisms both independent of and associated with microglial activation

Affiliations

Intracranially administered anti-Abeta antibodies reduce beta-amyloid deposition by mechanisms both independent of and associated with microglial activation

Donna M Wilcock et al. J Neurosci. .

Abstract

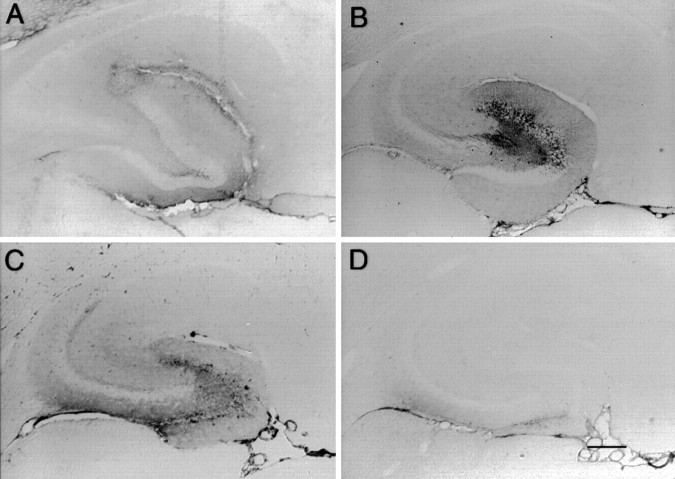
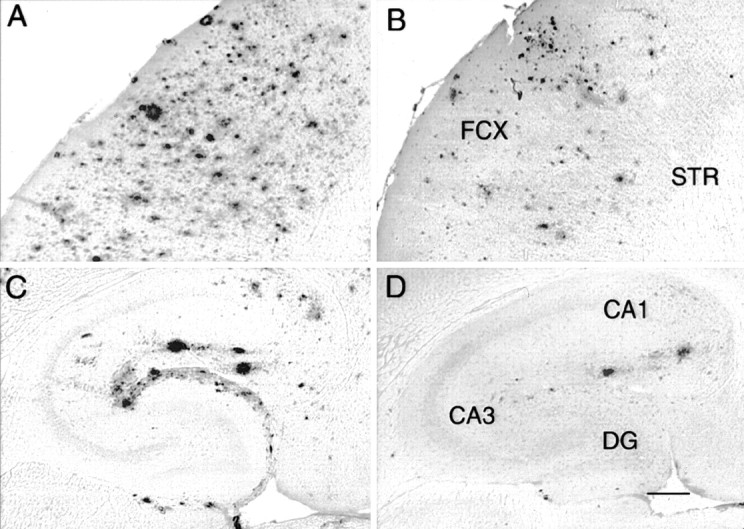
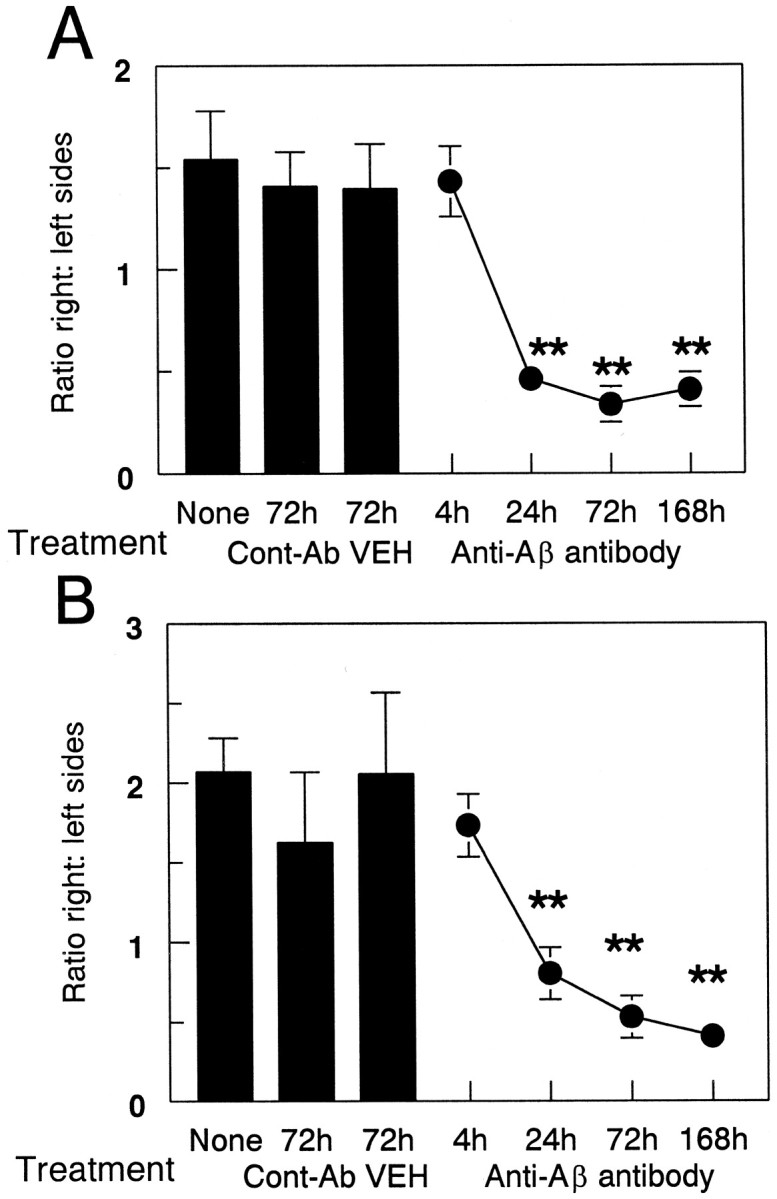
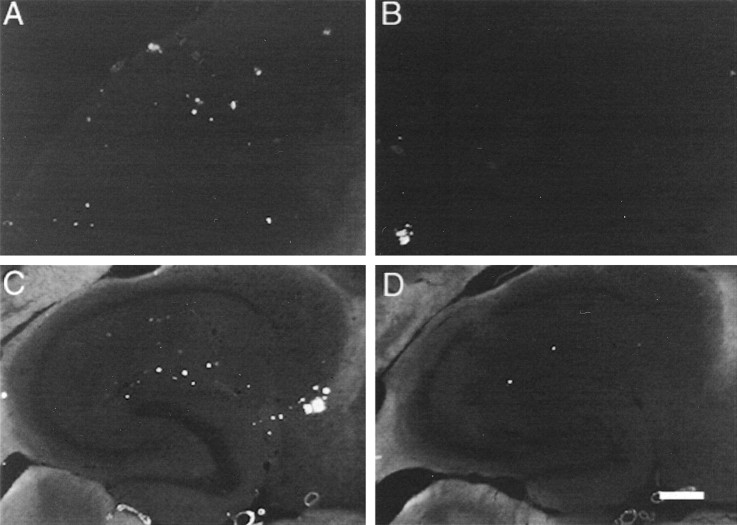
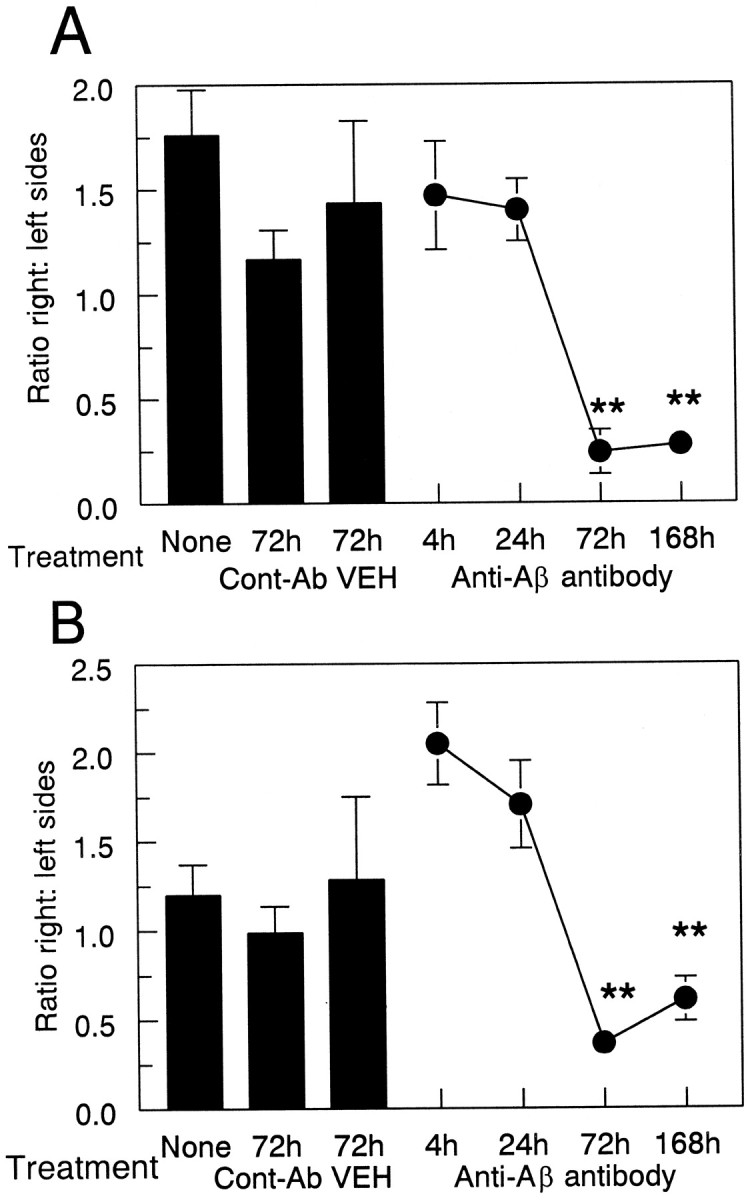
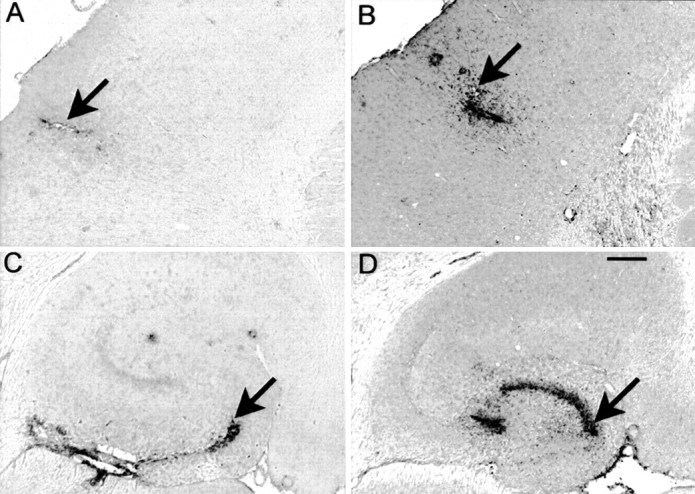
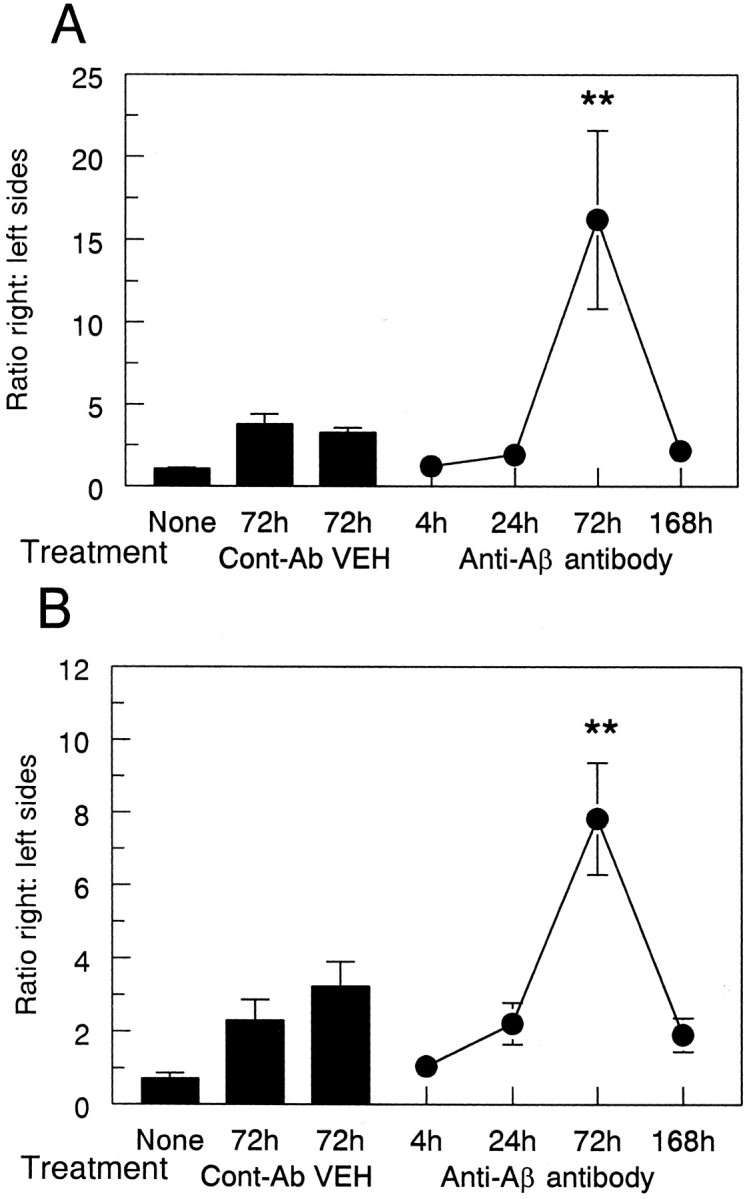
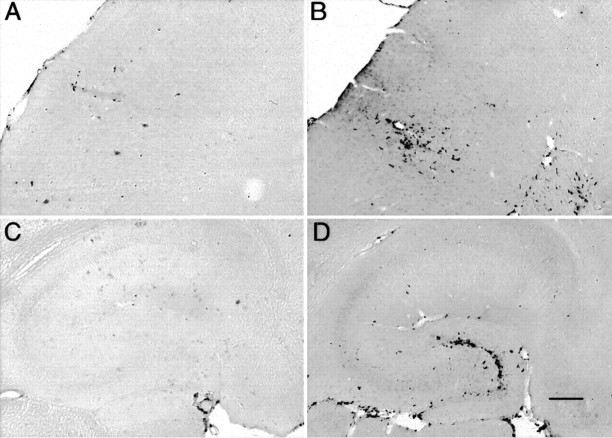
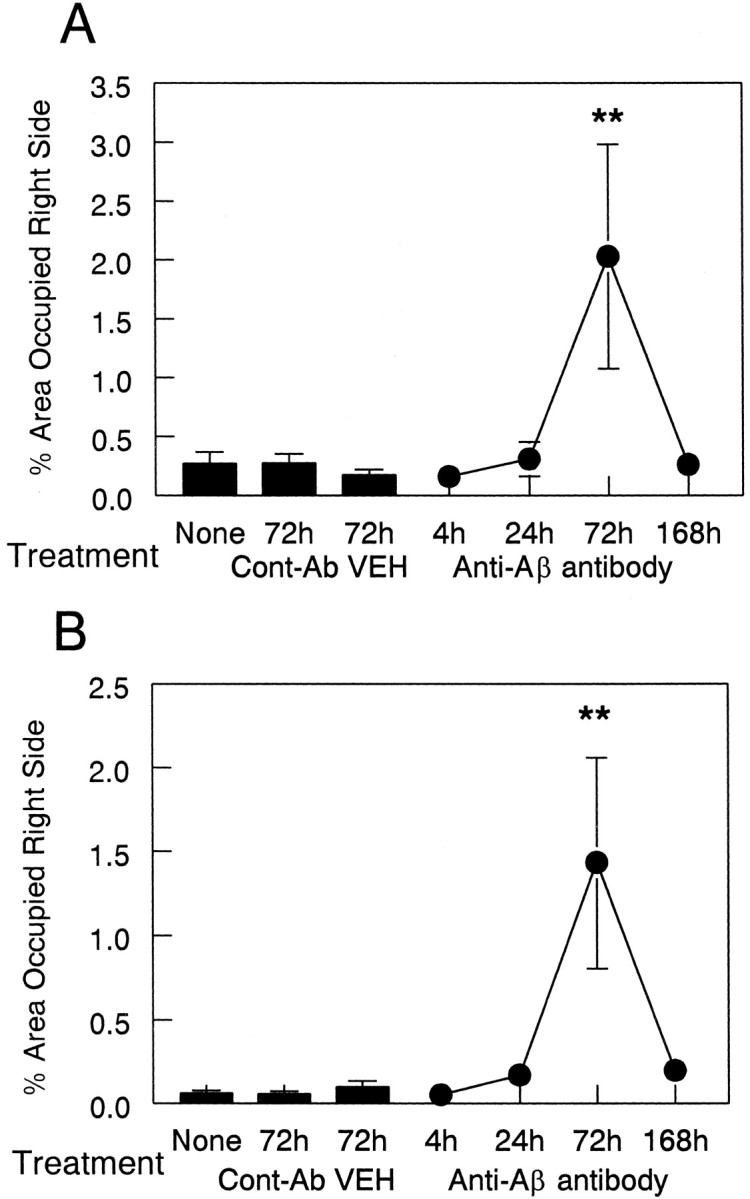
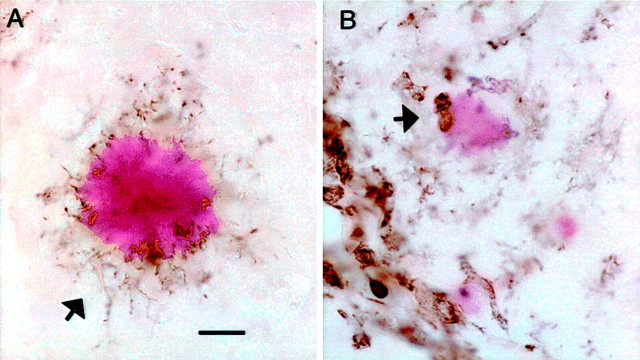
Active immunization against the beta-amyloid peptide (Alphabeta) with vaccines or passive immunization with systemic monoclonal anti-Abeta antibodies reduces amyloid deposition and improves cognition in APP transgenic mice. In this report, intracranial administration of anti-Alphabeta antibodies into frontal cortex and hippocampus of Tg2576 transgenic APP mice is described. The antibody injection resulted initially in a broad distribution of staining for the antibody, which diminished over 7 d. Although no loss of immunostaining for deposited Abeta was apparent at 4 hr, a dramatic reduction in the Alphabeta load was discernible at 24 hr and was maintained at 3 and 7 d. A reduction in the thioflavine-S-positive compact plaque load was delayed until 3 d, at which time microglial activation also became apparent. At 1 week after the injection, microglial activation returned to control levels, whereas Alphabeta and thioflavine-S staining remained reduced. The results from this study suggest a two-phase mechanism of anti-Alphabeta antibody action. The first phase occurs between 4 and 24 hr, clears primarily diffuse Alphabeta deposits, and is not associated with observable microglial activation. The second phase occurs between 1 and 3 d, is responsible for clearance of compact amyloid deposits, and is associated with microglial activation. The results are discussed in the context of other studies identifying coincident microglial activation and amyloid removal in APP transgenic animals.


Figures

Fig. 1.
Fig. 1.
Time course of injected anti-Αβ antibody distribution in the hippocampus from 4 hr to 7 d. Immunohistochemical staining is shown for the injected antibody in the hippocampus at 4 (A), 24 (B), 72 (C), and 168 (D) hr. Orientation and locations of hippocampal subregions are as in Figure 2D. Magnification, 40×. Scale bar, 120 μm. A high-resolution color version of this micrograph can be obtained by e-mail from D. Morgan (dmorgan@hsc.usf.edu).
Fig. 2.
Fig. 2.
Reduction in Αβ immunohistochemistry 1 d after anti-Αβ antibody injections. Immunohistochemical staining is shown for Αβ in the frontal cortex (A,B) and hippocampus (C,D).A and C are from an animal injected with control antibody, whereas animals for which stains are shown inB and D received the anti-Αβ antibody. Magnification, 40×. Scale bar, 120 μm. B, FCX, frontal cortex; STR, striatum. D, CA1, cornu ammonis 1; CA3, cornu ammonis 3; DG, dentate gyrus. A high-resolution color version of this micrograph can be obtained by e-mail from D. Morgan (dmorgan@hsc.usf.edu).
Fig. 3.
Fig. 3.
Quantification of reduced Αβ load after anti-Αβ antibody injections. Data are expressed as the ratio of Aβ staining in the injected hemisphere to the control hemisphere. The three bars on the left indicate the Αβ load in the untreated group (None) and the vehicle (VEH) and anti-HIV antibody (Cont-Ab) groups at 72 hr. The line shows the ratio of Αβ immunohistochemical staining at 4, 24, 72, and 168 hr survival times. Reduced Αβ load was observed in the frontal cortex (A) and hippocampus (B) at 24, 72, and 168 hr compared with 4 hr and both control groups (**p < 0.005).
Fig. 4.
Fig. 4.
Reduction in thioflavine-S staining 3 d after anti-Αβ antibody injections. Thioflavine-S staining is shown in frontal cortex (A, B) and hippocampus (C, D). Mice in A andC received control antibody, whereas those inB and D received anti-Αβ antibody. Magnification, 40×. Scale bar, 120 μm. Orientation and locations of major subregions are as in Figure 2, B andD. A high-resolution color version of this micrograph can be obtained by e-mail from D. Morgan (dmorgan@hsc.usf.edu).
Fig. 5.
Fig. 5.
Anti-Αβ antibody injections result in a reduction of thioflavine-S-positive plaques. Data are expressed as the ratio of thioflavine-S staining in the injected hemisphere to the control hemisphere. The three bars show thioflavine-S-positive staining in the untreated group (None) and the vehicle (VEH) and anti-HIV antibody (Cont-Ab) groups at 72 hr. The line shows the ratio of thioflavine-S staining at 4, 24, 72, and 168 hr survival times. Reduced thioflavine-S staining was observed in the frontal cortex (A) and hippocampus (B) at 72 and 168 hr compared with 4 and 24 hr and both control groups (**p < 0.005).
Fig. 6.
Fig. 6.
CD45 immunohistochemistry is increased 3 d after anti-Αβ antibody injections. CD45 immunohistochemistry is shown in frontal cortex (A, B) and hippocampus (C, D). Mice inA and C received control antibody, whereas those in B and D received anti-Αβ antibody. Magnification, 40×. Scale bar, 120 μm. Arrows indicate the site of injection identified from the needle tract. A high-resolution color version of this micrograph can be obtained by e-mail from D. Morgan (dmorgan@hsc.usf.edu).
Fig. 7.
Fig. 7.
Anti-Αβ antibody injections result in increased CD45 immunohistochemistry 3 d after injection. Data are expressed as the ratio of CD45 staining in the injected hemisphere to the control hemisphere. The three bars indicate CD45 expression in the untreated group (None) and the vehicle (VEH) and anti-HIV antibody (Cont-Ab) groups at 72 hr. The line shows the ratio of CD45 staining at 4, 24, 72, and 168 hr survival times. Increased CD45 staining was observed in the frontal cortex (A) and hippocampus (B) at 72 hr compared with 4, 24, and 168 hr and both control groups (**p < 0.005).
Fig. 8.
Fig. 8.
MHC-II immunohistochemistry is increased 3 d after anti-Αβ antibody injections. MHC-II immunohistochemistry is shown in frontal cortex (A, B) and hippocampus (C, D). Mice inA and C received control antibody, whereas those in B and D received anti-Αβ antibody. Magnification, 40×. Scale bar, 120 μm. A high-resolution color version of this micrograph can be obtained by e-mail from D. Morgan (dmorgan@hsc.usf.edu).
Fig. 9.
Fig. 9.
Anti-Αβ antibody injections result in an increase in MHC-II immunohistochemistry 3 d after injection. Data are expressed as percentage area occupied by MHC-II-positive staining in the injected hemisphere. The three bars indicate MHC-II expression in the untreated (None) group and the vehicle (VEH) and anti-HIV antibody (Cont-Ab) groups at 72 hr. The line shows the amount of MHC-II staining at 4, 24, 72, and 168 hr survival times. Increased MHC-II staining was observed in the frontal cortex (A) and hippocampus (B) at 72 hr compared with 4, 24, and 168 hr and both control groups (**p < 0.01).
Fig. 10.
Fig. 10.
Anti-Αβ antibody injections result in rounded microglia in association with remaining congophilic amyloid deposits 3 d after injection. CD45 immunostaining counterstained with Congo red is shown in the hippocampus at the 72 hr time point.A, Typical intensely stained congophilic deposit surrounded by CD45 immunostained microglial processes, with faintly stained somata (arrow). B, Faintly stained congophilic deposit in the anti-Αβ antibody-injected hippocampus. Note the two rounded intensely CD45-positive cells in contact with the faintly stained deposit (arrow). Magnification, 600×. Scale bar, 8.33 μm.

Similar articles

Cited by

References

    1. Bacskai BJ, Kajdasz ST, Christie RH, Carter C, Games D, Seubert P, Schenk D, Hyman BT. Imaging of amyloid-beta deposits in brains of living mice permits direct observation of clearance of plaques with immunotherapy. Nat Med. 2001;7:369–372. - PubMed
    1. Bacskai BJ, Kajdasz ST, McLellan ME, Games D, Seubert P, Schenk D, Hyman BT. Non-Fc-mediated mechanisms are involved in clearance of amyloid-β in vivo by immunotherapy. J Neurosci. 2002;22:7873–7878. - PMC - PubMed
    1. Bard F, Cannon C, Barbour R, Burke RL, Games D, Grajeda H, Guido T, Hu K, Huang J, Johnson-Wood K, Khan K, Kholodenko D, Lee M, Lieberberg I, Motter R, Nguyen M, Soriano F, Vasquez N, Weiss K, Welch B. Peripherally administered antibodies against amyloid β-peptide enter the central nervous system and reduce pathology in a mouse model of Alzheimer's disease. Nat Med. 2000;6:916–919. - PubMed
    1. Chapman PF, White GL, Jones MW, Cooper-Blacketer D, Marshall VJ, Irizarry M, Younkin L, Good MA, Bliss TVP, Hyman BT, Younkin SG, Hsiao KK. Impaired synaptic plasticity and learning in aged amyloid precursor protein transgenic mice. Nat Neurosci. 1999;2:271–276. - PubMed
    1. DeMattos RB, Bales KR, Cummins DJ, Dodart JC, Paul SM, Holtzman DM. Peripheral anti-Aβ antibody alters CNS and plasma Aβ clearance and decreases brain Aβ burden in a mouse model of Alzheimer's disease. Proc Natl Acad Sci USA. 2001;98:8850–8855. - PMC - PubMed

Publication types

MeSH terms