. 2003 May 1;23(9):3796-806.
doi: 10.1523/JNEUROSCI.23-09-03796.2003.

Bandpass filtering at the rod to second-order cell synapse in salamander (Ambystoma tigrinum) retina

Affiliations

Bandpass filtering at the rod to second-order cell synapse in salamander (Ambystoma tigrinum) retina

Cecilia E Armstrong-Gold et al. J Neurosci. .

Abstract

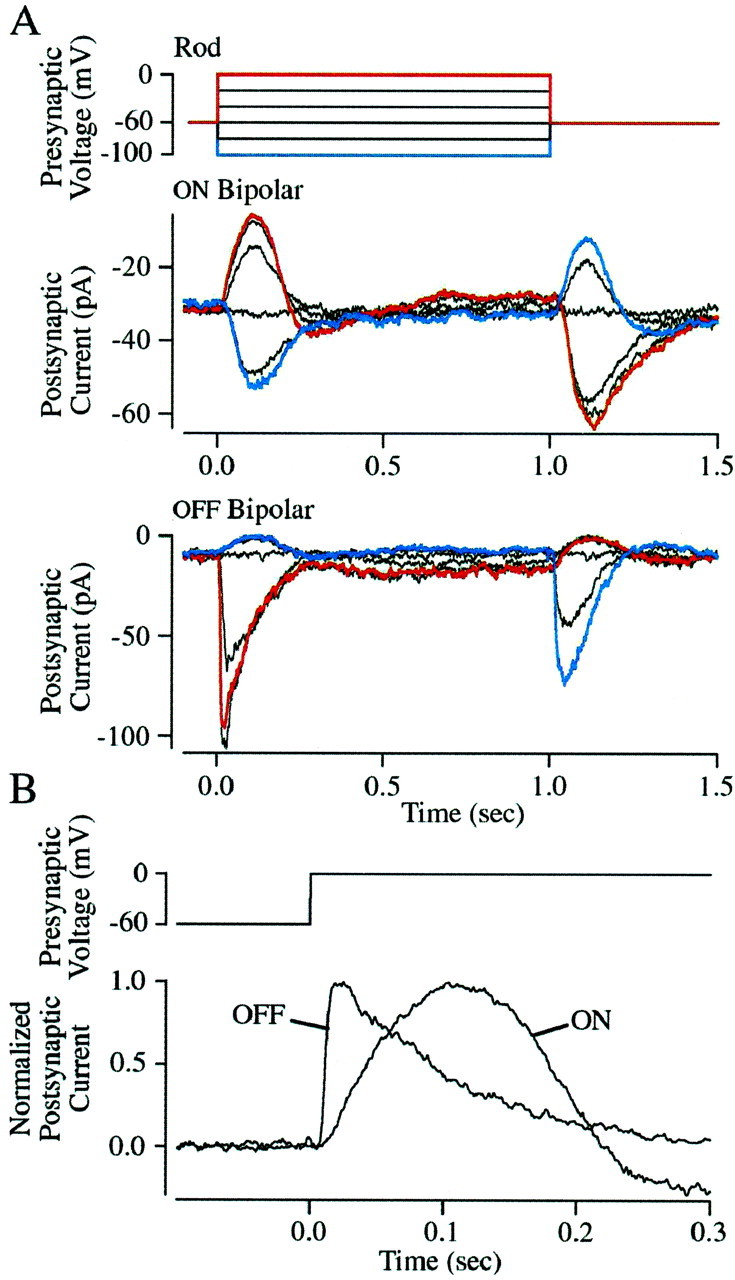
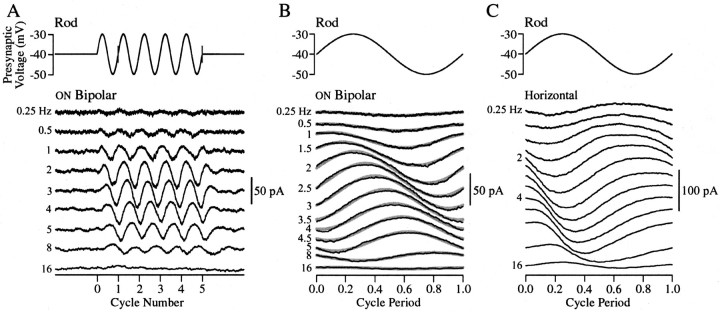
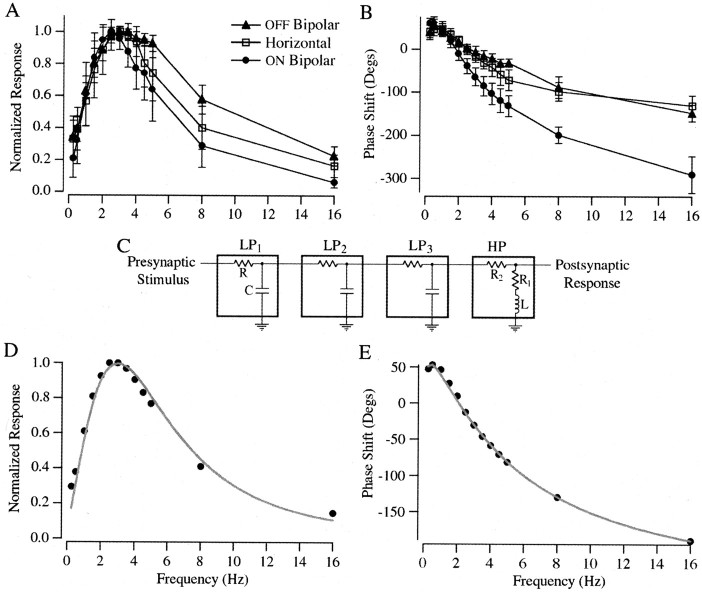
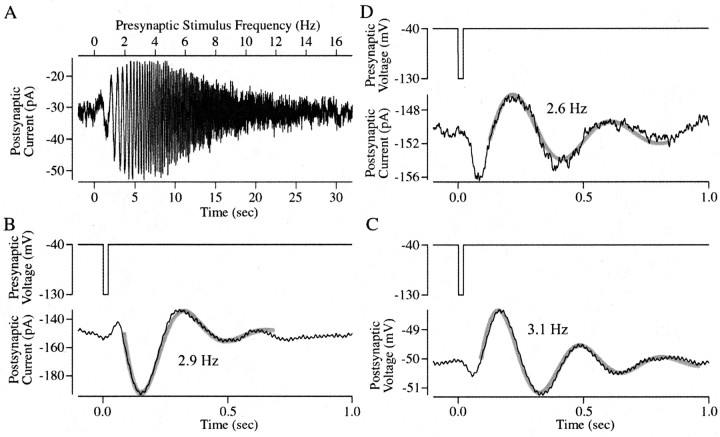
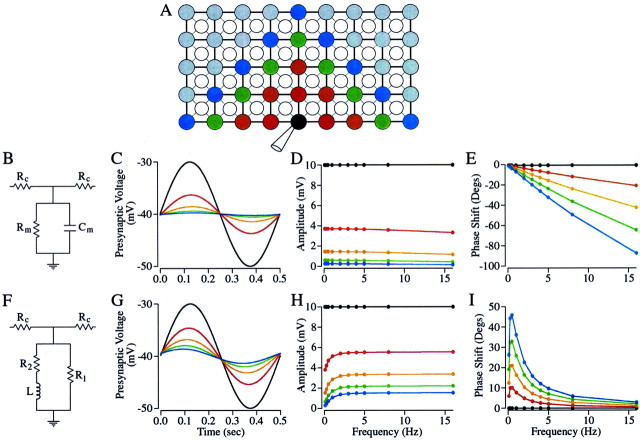
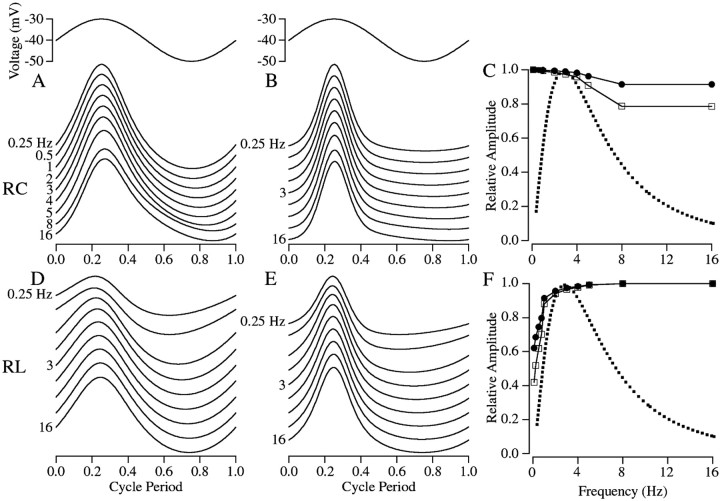
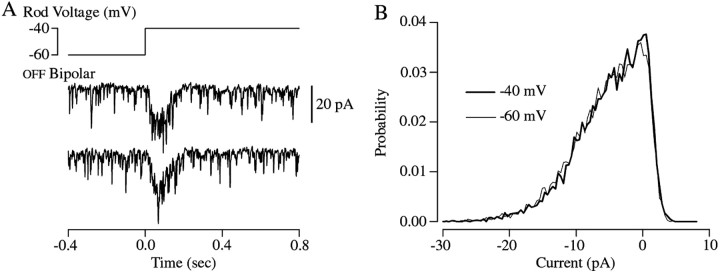
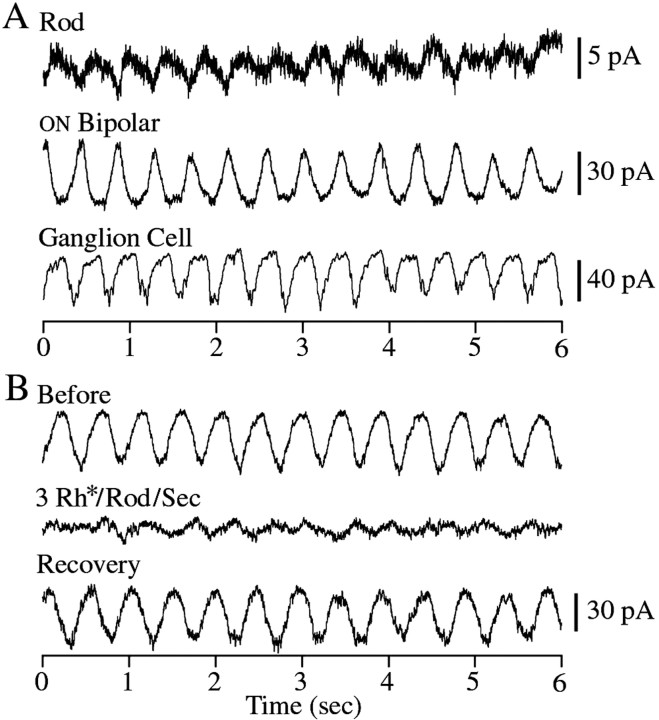
The ability to see at night relies on the transduction of single photons by the rod photoreceptors and transmission of the resulting signals through the retina. Using paired patch-clamp recordings, we investigated the properties of the first stage of neural processing of the rod light responses: signal transfer from rods to bipolar and horizontal cells. Bypassing the relatively slow phototransduction process and directly modulating the rod voltage or current allowed us to characterize signal transfer over a wide range of temporal frequencies. We found that the rod to second-order cell synapse acts as a bandpass filter, preferentially transmitting signals with frequencies between 1.5 and 4 Hz while attenuating higher and lower frequency inputs. The similarity of the responses in different types of postsynaptic cell and the properties of miniature EPSCs (mEPSCs) recorded in OFF bipolar cells suggest that most of the bandpass filtering is mediated presynaptically. Modeling of the network of electrically coupled rod photoreceptors suggests that spread of the signal through the network contributed to the observed high-pass filtering but not to the low-pass filtering. Attenuation of low temporal frequencies at the first retinal synapse sharpens the temporal resolution of the light response; attenuation of high temporal frequencies removes voltage noise in the rod that threatens to swamp the light response.


Figures

Fig. 1.
Fig. 1.
Presynaptic and postsynaptic kinetics.A, Postsynaptic current responses recorded in an ON and an OFF bipolar cell elicited by a family of presynaptic voltage steps. The presynaptic stimulus is shown in the top panel. Responses elicited by steps to 0 and −100 mV are highlighted in red and blue. The ON bipolar responses are the average of 10 stimulus presentations and the OFF bipolar responses are the average of 5. All of the cells were held at −60 mV. B, Comparison of the time course of the ON and OFF bipolar cell responses elicited by presynaptic voltage steps to 0 mV. Both responses were normalized to have amplitudes of +1.
Fig. 2.
Fig. 2.
Presynaptic sinewaves. A, Postsynaptic current responses recorded in an ON bipolar cell elicited by presynaptic sinewaves centered around −40 mV. The presynaptic stimulus is shown in the top panel. The frequency of the sinewave used to elicit each response is indicated to the left. Each trace is the average of three stimulus presentations. B, The cycle average (black traces) of the postsynaptic response in an ON bipolar cell. The cycle average was calculated by averaging the response at each frequency elicited by the four cycles between the gray markers on the stimulus wave in A. In this cell the cycle average was well fit by a sinewave (thick gray traces). Data are from the same cell as in A. Not all of the stimulus frequencies shown in B are in A. C, The cycle average of postsynaptic responses in a horizontal cell elicited by presynaptic sinewaves. Stimulus frequencies are the same as inB. Both postsynaptic cells were held at −60 mV; the ON bipolar cell had a resting current of −114 pA (with the rod held at −40 mV), and the horizontal cell had a resting current of −200 pA. Note that the time axis in each trace has been normalized by the stimulus period to facilitate comparison.
Fig. 3.
Fig. 3.
Bandpass of synaptic transmission.A, Normalized response amplitude versus frequency plots of postsynaptic responses recorded in OFF bipolar (▴), horizontal (■), and ON bipolar (●) cells. B, Phase shift versus frequency plots of the postsynaptic responses. Symbols are the same as in A. A positive phase shift indicates that the postsynaptic response led the presynaptic stimulus, whereas a negative value indicates that the response lagged the stimulus. Values inA and B are mean ± SD.C, The bandpass of synaptic transmission from rods to second-order retina cells was well fit by a series of three low-pass filters (LP1–3) and one high-pass filter (HP). The low-pass filters were modeled as a resistor (R) in series with a capacitor (C), and the high-pass filter was modeled as two resistors (R1 andR2) in series with an inductor (L). The fits in D andE were obtained with time constants (τ =R*C) of 35 msec for LP1 and LP2, a time constant of 15 msec for LP3, and values of 32 Ω, 1 Ω, and 1.2 H, respectively, for R1,R2, and L. Normalized response amplitude versus frequency plot (D, black dots) and phase versus frequency plot (E) of the average postsynaptic responses across the three cell types is shown. The smooth gray lines represents the fit of the data with the model diagrammed in C.
Fig. 4.
Fig. 4.
Probing the bandpass of synaptic transmission using other presynaptic stimuli. A, Postsynaptic current response recorded in an ON bipolar cell elicited by a presynaptic sinewave that increased linearly in frequency. The presynaptic frequency sweep lasted 30 sec, was 10 mV in amplitude, was centered around −40 mV, and had a maximum frequency of 16 Hz. The top axis indicates the frequency of the presynaptic stimulus, and the bottom axis indicates time. Postsynaptic current (B) and voltage (C) responses in a horizontal cell and current responses in an ON bipolar cell (D, black traces) elicited by 20 msec duration presynaptic voltage steps to −130 mV from a holding potential of −40 mV are shown. The presynaptic stimulus is shown at the top of each panel. These impulse responses were well fit by a sinewave that decays in amplitude (gray traces; see Results for equation). The frequency of the fit decaying sinewave is indicated. Postsynaptic cells were held at −60 mV in B andD.
Fig. 5.
Fig. 5.
Modeling the rod network. A, Diagram of the rod network (adapted from Attwell, 1986). The rods (filled circles) are organized into a square array with the cones (open circles) between the rods. Lines between cells indicate electrical coupling. In this model the rod array was cut horizontally. The black circle is the primary rod to which the voltage signal is applied. The red, orange, green, and blue circles are the second, third, fourth, and fifth rods, respectively, downstream from the primary rod. The stimulus applied to the primary rod was 10 mV in amplitude centered around −40 mV. The stimulus frequency varied from 0.1 to 16 Hz. The resting potential of the other rods in the network was −40 mV.BE, RC circuit model of the rod membrane. B, Diagram of the model RC circuit. The rod membrane is modeled as capacitor (Cm) in parallel with a resistor (Rm). Each rod in the array is connected to neighboring rods through a coupling resistance (Rc). The values of the circuit elements used in this model areRc = 300 MΩ,Rm = 0.5 GΩ, andCm = 26 pF. C, Modeled voltage signal in each cell type resulting from a 2 Hz sinewave applied to the primary rod. D, Plot of amplitude of the voltage change in each cell versus frequency. E, Plot of the phase of the voltage change in each cell versus frequency.FI, RL circuit model of the rod membrane (Owen and Torre, 1983; Torre and Owen, 1983).F, In this model the rod membrane is modeled as an inductor (L) in series with a resistor (R2), both of which are in parallel with a second resistor (R1). As in the RC model, each rod is connected to neighboring rods through a resistor (Rc). The values of the elements in this model are RC = 360 MΩ, L = 0.5 GH,R1 = 710 MΩ, andR2 = 3.3 GΩ (Owen and Torre, 1983).G, Modeled voltage signal in each cell type resulting from a 2 Hz sinewave applied to the primary rod. H, Plot of amplitude of the voltage change in each cell versus frequency.I, Plot of the phase of the voltage change in each cell versus frequency. Colors are consistent throughout the figure. Note that although the rods straight above the primary rod have three downstream cells, those horizontal or diagonal from the primary rod have only two downstream cells. Although the data shown in this figure are only from the rods that have two downstream cells, our final model included the contribution made by the rods with three downstream cells.
Fig. 6.
Fig. 6.
Transmitter release modeled from the rod network. Predicted release for network models with the rod membrane modeled as an RC (A–C) or an RL circuit (D–F). Release was either assumed to scale linearly with the calcium concentration ([Ca2+]) (A, D) or as the square of [Ca2+] (B, E). The predicted waveform of release for frequencies between 0.25 and 16 Hz is shown with the time axis normalized by the stimulus period to facilitate comparison. The amplitude of the release predicted by each model is shown as a function of frequency (C,F), with the open squares showing the amplitude of release when linearly dependent on [Ca2+] and with the closed circles showing the amplitude of release when dependent on the square of [Ca2+]. The dotted trace is the fit of the measured bandpass of transmission from Figure3D.
Fig. 7.
Fig. 7.
Bandpass filtering cannot be explained by postsynaptic mechanisms. A, Response of an OFF bipolar cell to step depolarization of a rod from −60 to −40 mV. The noisy traces show two individual responses; the brief inward currents are mEPSCs. B, Histograms of the current minima from 17 trials like those in A. Histograms for rod voltages of −60 and −40 mV are plotted. Current minima were identified as recorded data points with amplitudes smaller than the adjacent points (1 msec sampling interval, bandwidth 0–300 Hz). Only sections of data recorded >400 msec after the voltage step were used.
Fig. 8.
Fig. 8.
Spontaneous oscillations in the salamander retina.A, Spontaneous current oscillations in a rod, an ON bipolar cell, and a retinal ganglion cell. The rod and ON bipolar cell traces were recorded simultaneously. In both of these cells the frequency of the oscillations was 2.3 Hz. The oscillations in the ganglion cell were 2.4 Hz. The oscillations in the rod, ON bipolar cell, and ganglion cell were centered around −96, −169, and −50 pA, respectively. B, Oscillations in an ON bipolar cell are suppressed by dim light. Current recordings were measured from an ON bipolar cell before, during, and after dim illumination, producing approximately three photoisomerizations per rod per second. The oscillations before and after illumination had frequencies of 2.2 and 2.1 Hz and were centered around −24 and −39 pA, respectively. The resting current during illumination was −25 pA. All cells were held at −60 mV.
Fig. 9.
Fig. 9.
Bandpass filtering accounts for most of the change in kinetics in rods and second-order cells. A, Normalized responses in a rod (light trace) and an ON bipolar cell (dark trace) elicited by a 10 msec duration full-field flash producing ∼11 photoisomerizations per rod. The timing of the flash is shown in the top trace. The responses shown are the average of five responses.B, Predicted second-order retinal cell response (dark trace) constructed by passing the average response from 11 rods elicited by the same stimulus as in A (light trace) through the bandpass filter modeled in Figure 3C.

References

    1. Ashmore JF, Copenhagen DR. Different postsynaptic events in two types of retinal bipolar cell. Nature. 1980;288:84–86. - PubMed
    1. Ashmore JF, Falk G. Responses of rod bipolar cells in the dark-adapted retina of the dogfish, Scyliorhinus canicula. J Physiol (Lond) 1980;300:115–150. - PMC - PubMed
    1. Attwell D. The Sharpey-Schafer lecture: ion channels and signal processing in the outer retina. Quart J Exp Physiol. 1986;71:497–536. - PubMed
    1. Attwell D, Wilson M. Behaviour of the rod network in the tiger salamander retina mediated by membrane properties of individual rods. J Physiol (Lond) 1980;309:287–315. - PMC - PubMed
    1. Attwell D, Wilson M, Wu SM. A quantitative analysis of interactions between photoreceptors in the salamander (Ambystoma) retina. J Physiol (Lond) 1984;352:703–737. - PMC - PubMed

Publication types

MeSH terms

LinkOut - more resources