. 2003 May 1;23(9):3807-19.
doi: 10.1523/JNEUROSCI.23-09-03807.2003.

Gene microarrays in hippocampal aging: statistical profiling identifies novel processes correlated with cognitive impairment

Affiliations

Gene microarrays in hippocampal aging: statistical profiling identifies novel processes correlated with cognitive impairment

Eric M Blalock et al. J Neurosci. .

Abstract

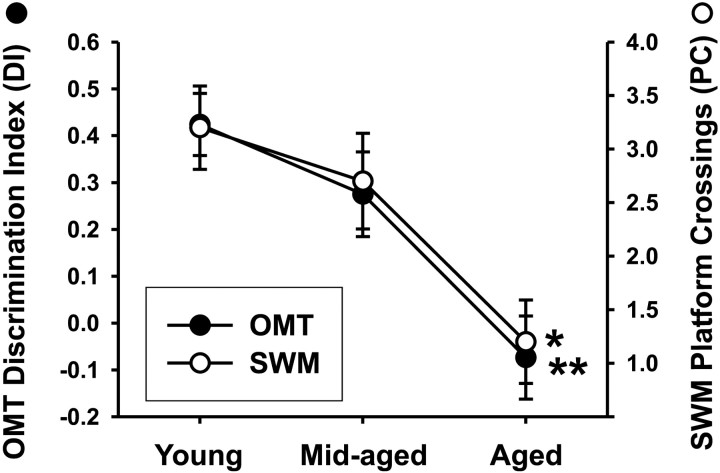
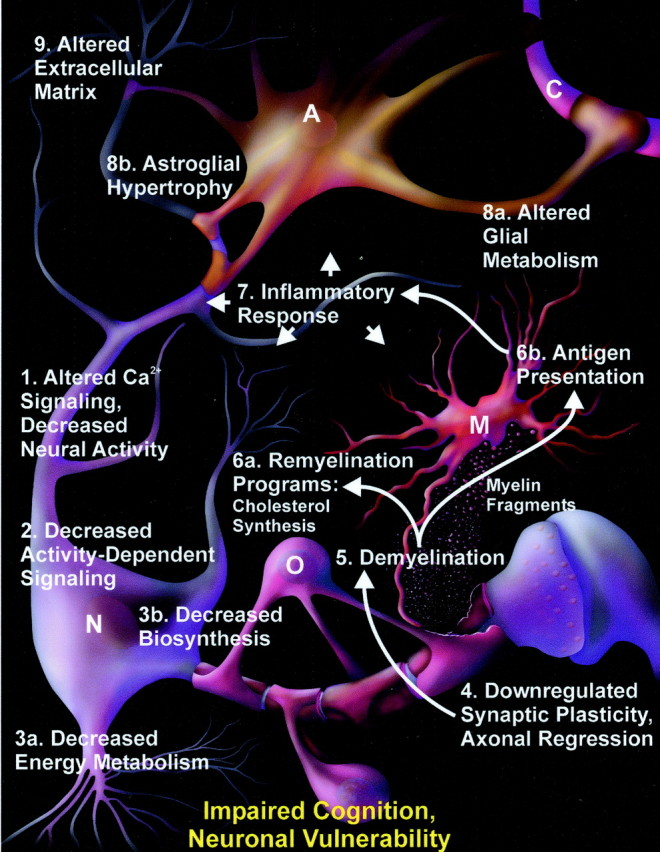
Gene expression microarrays provide a powerful new tool for studying complex processes such as brain aging. However, inferences from microarray data are often hindered by multiple comparisons, small sample sizes, and uncertain relationships to functional endpoints. Here we sought gene expression correlates of aging-dependent cognitive decline, using statistical profiling of gene microarrays in well powered groups of young, mid-aged, and aged rats (n = 10 per group). Animals were trained on two memory tasks, and the hippocampal CA1 region of each was analyzed on an individual microarray (one chip per animal). Aging- and cognition-related genes were identified by testing each gene by ANOVA (for aging effects) and then by Pearson's test (correlating expression with memory). Genes identified by this algorithm were associated with several phenomena known to be aging-dependent, including inflammation, oxidative stress, altered protein processing, and decreased mitochondrial function, but also with multiple processes not previously linked to functional brain aging. These novel processes included downregulated early response signaling, biosynthesis and activity-regulated synaptogenesis, and upregulated myelin turnover, cholesterol synthesis, lipid and monoamine metabolism, iron utilization, structural reorganization, and intracellular Ca2+ release pathways. Multiple transcriptional regulators and cytokines also were identified. Although most gene expression changes began by mid-life, cognition was not clearly impaired until late life. Collectively, these results suggest a new integrative model of brain aging in which genomic alterations in early adulthood initiate interacting cascades of decreased signaling and synaptic plasticity in neurons, extracellular changes, and increased myelin turnover-fueled inflammation in glia that cumulatively induce aging-related cognitive impairment.


Figures

Fig. 1.
Fig. 1.
Age-dependent impairment of memory performance. Aged animals exhibited significantly reduced performance on 24 hr memory retention on both the SWM and OMT tasks in comparison with either young or mid-aged animals (one-way ANOVA and Tukey'spost hoc). The young and mid-aged animals did not differ from each other on either task. On the SWM task, higher platform crossings (PC) reflects greater retention of the spot where the platform was previously located. For the OMT, a higher discrimination index (DI) reflects greater retention of the previously explored object and resultant increased exploration of the novel object (see Materials and Methods). *p < 0.01; **p≤ 0.001.
Fig. 2.
Fig. 2.
Filtering and statistical test algorithm for identifying aging- and cognition-related genes (ACRGs). The initial set of 8799 gene probe sets contained on the HG-U34A gene chip was reduced according to a priori filters before statistical testing to decrease multiple comparisons and expected false positives. Gene probe sets were removed if they were called absent (1a), if they were ESTs (1b), or if the difference between the young and aged groups did not comprise at least 75% of the maximal normalized age differences (1c). Each of the remaining 1985 (gene) probe sets was then tested by ANOVA across the three age groups (n = 9–10 per group) to determine whether it changed significantly with aging (2). Each of the 233 genes that changed significantly with age (p ≤ 0.025) was then tested across all animals (n = 29) for significant behavioral correlation with the OMT and SWM 24 hr retention values (Pearson's;p ≤ 0.025). Age-dependent genes that correlated with either or both tasks were identified as primary ACRGs. Additionally, 11 genes that were not correlated behaviorally were included as ACRGs (3b) because their age-dependent alterations were significant at a much higher confidence level (ANOVA;p ≤ 0.001).
Fig. 3.
Fig. 3.
Correlation of gene expression and OMT performance across all animals. Five representative examples of high positive correlations with OMT scores among genes that decreased with aging (A) and five examples of high negative correlations among genes that increased with aging (B). Standardized expression values are shown on the left y-axis and standardized OMT performance scores (DI) are plotted on the x-axis. Some points are obscured by overlapping values for expression or retention. OMT retention performance increases with increasingly positive (leftward) values of the graph. Note the clustering of gene expression values for aged animals toward the low performance (right) side.
Fig. 4.
Fig. 4.
Age course of genes altered with aging.A, Chronological aging patterns for the mean expression values of all genes in the five representative functional categories containing the most ACRGs downregulated with aging (Table 1A, on-line Table 3). The expression of each gene was standardized (see Materials and Methods) before category mean values were calculated. Additionally, ACRGs were classified on the basis of the two age points between which 75% of the expression change occurred. Note that most categories of downregulated ACRGs exhibited ≥75% mean change by the mid-aged point (Yng to Mid), tending to level off between the mid-aged and aged groups. However, many downregulated genes also showed a more monotonic pattern (Yng to Age). No category showed a predominantly mid to aged pattern of change. Pie chart inset: Relative distribution of chronological patterns of change for all individual downregulated ACRGs. B, Chronological aging patterns for the mean expression changes of all genes in the five largest functional categories of upregulated ACRGs (Table 1B, on-line Table 4). Calculations and nomenclature as in Figure 4A. Note that in comparison with downregulated genes (A), more upregulated genes (B) exhibited continuing change between mid life and late life (e.g., a monotonic pattern) (pie chart insets).
Fig. 5.
Fig. 5.
Integrative model of brain aging. Numbers represent one putative sequence of events leading to aging-related cognitive impairment. Arrows indicate hypothesized causal interactions for the inflammatory cascade component. Altered Ca2+and synaptic signaling (1) in neurons (N) reduce neural activity responses, which then activate genomic alterations that downregulate activity-dependent signaling pathways (2) and induce general neuronal, metabolic, and biosynthetic involution (3a,b). These involutional changes induce other transcriptional alterations that downregulate the capacity for neurite outgrowth, synaptogenesis, and maintenance of extracellular structure (4). The weakening of extracellular structure and axonal regression trigger an initial demyelination process (5) that in turn activates remyelinating programs and associated cholesterol biosynthesis/transport (6a) in oligodendrocytes (O). Concurrently, myelin fragments are endocytosed by glia and degraded to antigenic epitopes that stimulate innate autoimmunity and antigen presentation (6b) in microglia (M). These autoimmune responses then activate a glial-mediated inflammatory cascade (7) in microglia (M) and astrocytes (A), associated with altered glial metabolism (8a) and glucose uptake from capillaries (C) and astrocytic hypertrophy (8b). The increasing inflammatory and glial activation induce additional extracellular matrix transformation and neuronal erosion (9) and exacerbate demyelination. The accumulating inflammatory damage (7) and extracellular changes (9) eventually interact with decreased neuronal activity (1) and synaptic plasticity (4) to impair cognition and increase neuronal vulnerability (bottom).

References

    1. Andreasson KI, Savonenko A, Vidensky S, Goellner JJ, Zhang Y, Shaffer A, Kaufmann WE, Worley PF, Isakson P, Markowska AL. Age-dependent cognitive deficits and neuronal apoptosis in cyclooxygenase-2 transgenic mice. J Neurosci. 2001;21:8198–8209. - PMC - PubMed
    1. Austad SN. Why we age: what science is discovering about the body's journey through life. Wiley; Indianapolis: 1999.
    1. Bal-Price A, Brown GC. Inflammatory neurodegeneration mediated by nitric oxide from activated glia-inhibiting neuronal respiration, causing glutamate release and excitotoxicity. J Neurosci. 2001;21:6480–6491. - PMC - PubMed
    1. Barnes CA. Normal aging: regionally specific changes in hippocampal synaptic transmission. Trends Neurosci. 1994;17:13–18. - PubMed
    1. Becker KG (2002) Deciphering the gene expression profile of long-lived Snell mice. In: http://sageke.sciencemag.org - PubMed

Publication types

MeSH terms