. 2003 May 1;23(9):3855-68.
doi: 10.1523/JNEUROSCI.23-09-03855.2003.

Neural correlates of competing fear behaviors evoked by an innately aversive stimulus

Affiliations

Neural correlates of competing fear behaviors evoked by an innately aversive stimulus

Raymond Mongeau et al. J Neurosci. .

Abstract

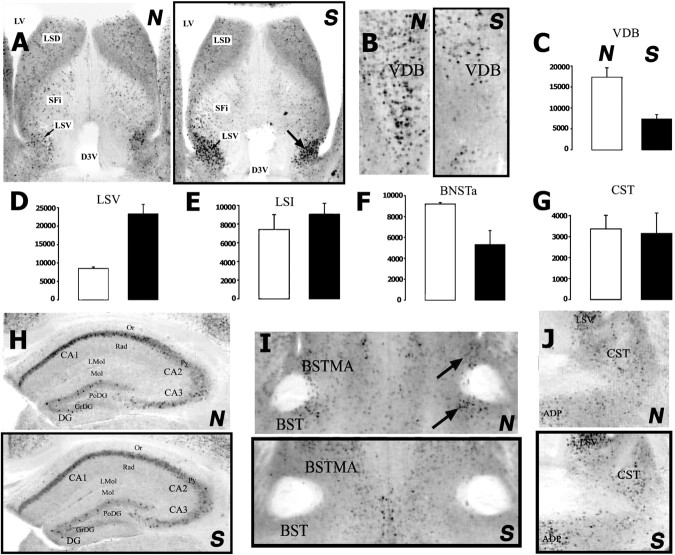
Environment and experience influence defensive behaviors, but the neural circuits mediating such effects are not well understood. We describe a new experimental model in which either flight or freezing reactions can be elicited from mice by innately aversive ultrasound. Flight and freezing are negatively correlated, suggesting a competition between fear motor systems. An unfamiliar environment or a previous aversive event, moreover, can alter the balance between these behaviors. To identify potential circuits controlling this competition, global activity patterns in the whole brain were surveyed in an unbiased manner by c-fos in situ hybridization, using novel experimental and analytical methods. Mice predominantly displaying freezing behavior had preferential neural activity in the lateral septum ventral and several medial and periventricular hypothalamic nuclei, whereas mice predominantly displaying flight had more activity in cortical, amygdalar, and striatal motor areas, the dorsolateral posterior zone of the hypothalamus, and the vertical limb of the diagonal band. These complementary patterns of c-fos induction, taken together with known connections between these structures, suggest ways in which the brain may mediate the balance between these opponent defensive behaviors.


Figures

Fig. 1.
Fig. 1.
Modulation of defense reactions to an innately aversive ultrasound (USS). The frequency of flight (A) and freezing (B) is compared for N (white bars) and S (black bars) mice. A, S mice showed significantly less flight than N mice (ANOVA,p < 0.01), as did mice exposed to the USS in a new cage (p < 0.05). B, S mice showed significantly more freezing than N mice in their home cages (p < 0.01), as did mice in a new cage (p = 0.01). Data represent mean ± SEM;n = 5–7 mice. C, Correlation analysis with all parameters combined revealed a significant (ANOVA,p < 0.001;r2 = 0.6) negative correlation between the frequency of flight and freezing. Each point represents a single animal (n = 38). The coefficient of variation of the slope was 9%.
Fig. 2.
Fig. 2.
Functional imaging using quantitative analysis of c-fos+ cells.A, Background levels of c-fos mRNA in N (blue box) and S (red box) mice. Control mice in their home cages had extremely low staining. The region illustrated is the PAG and is representative of other regions examined. The USS induced c-fos+ cells in the dorsomedial and lateral periaqueductal gray (DMPAG, LPAG) and in the dorsal raphe (DR), as well as at the boundary of the cuneiform and the pedunculupontine nuclei (CnF, PPTg; white arrow). B, C, Photomicrographs in B indicate c-fos+cells in the region of the inferior colliculus (IC; arrows) tonotopically appropriate to the USS, and those in Cshow a higher density of c-fos+ cells in the motor cortex of N mice exhibiting more flight than S mice (seeE for quantification). D, Images illustrating the macroanalysis procedure. High-magnification photographs taken with a 6× objective are automatically assembled into a low-magnification mosaic of entire coronal sections using the Virtual Slice module of the Neurolucida program. This mosaic is then automatically transformed to a vector image representing the distribution of strongly stained cells (yellow dots). E, Stereological data (cells per cubic millimeter ± SEM) showing the enhancement in motor cortical activity in N versus S mice. Student'st tests indicated a significant (p < 0.05) increase in the hindlimb area of the motor cortex (M1, l, M2, l). F, Portions of overlaid macroanalysis images from three sections spanning 360 μm were used to view the distribution of densely stained cell profiles in functional columns of the rostral portion of the DMPAG and LPAG (arrows).G, Photomicrographs (40×) illustrating single-cell resolution of the c-fos mRNA in situhybridization signals used for stereological measurements. For details, see Materials and Methods.
Fig. 3.
Fig. 3.
Data indicating changes in the density and the distribution of c-fos+ cells in the hypothalamus. In N mice, staining was more intense in the lateral portion of the posterior hypothalamus (PH; A, arrow), and in the dorsal portion of the lateral hypothalamus (LH;C), but not in the medial hypothalamus [dorsal and ventral nuclei (DM, VM)]. Stereological counting (cells per cubic millimeter ± SEM; in this and all subsequent figures, white bars, N mice; black bars, S mice) indicated a greater density of c-fos+ cells in N versus S mice in the PH located between AP −1.8 and −2.5 mm (volume, 0.193 ± 0.015 mm3; p = 0.059;B) and in the dorsal LH located between AP −1.3 and −1.8 mm (volume, 0.113 ± 0.001 mm3;p < 0.05; D). Virtual sections and arrows show more intense staining in S mice in the dorsal and magnocellular portions of the paraventricular nucleus [PaD, PaM; no change in the central or lateral portion of the anterior hypothalamus (AH, LA); E] and in the medial and ventral portions of the MPO (G). I, K, Photomicrographs show a cluster of cells in the ADP of S mice and its relative absence in N mice (I) and in cells more apparent at the boundary of the PMv and the arcuate nucleus (Arc) in S mice (K). There was the same apparent number of cells in the dorsal PMd. Stereological counting (cells per cubic millimeter ± SEM) indicated a greater density of c-fos+ cells in S versus N mice in the Pa located between AP −0.5 and −1.1 mm (volume, 0.059 ± 0.001 mm3; p < 0.05;F), the MPO located between AP 0.0 and −0.6 mm (volume, 0.235 ± 0.002 mm3;p < 0.05; H), the ADP located between AP +0.3 and −0.3 mm (volume, 0.037 ± 0.002 mm3; p < 0.01;J), and the PMv and Arc located between AP −2.1 and −2.7 mm (volume, 0.045 ± 0.003 mm3;p < 0.01; L).
Fig. 4.
Fig. 4.
Pattern and density of staining in septo-hippocampal areas. Photomicrographs of the pattern of staining in the dorsal, intermediate, and ventral portions of the lateral septum (LSD, LSI, LSV; A), and the vertical limb of the diagonal band (VDB; B) are shown. Unframed images for each pair are from N mice; black-framed images are from S mice. Stereological counting (cells per cubic millimeter ± SEM) was performed in the VDB located between AP +1.2 and +1.3 mm (volume, 0.041 ± 0.004 mm3; C), the LSV located between AP +0.1 and –0.7 mm (volume, 0.120 ± 0.004 mm3; D), and the LSI located between AP +0.5 and +0.5 mm (volume, 0.255 ± 0.018 mm3; E). Student's ttests indicated significant group differences for the LSV (p < 0.01) and the VDB (p = 0.01), but not for the LSI.H, There were no differences between N and S mice at the level of the dorsal hippocampus. Note the high density of cells in the pyramidal layer of CA1–CA3. There were contrasting effects in the BNSTa and CST. I, J, Photomicrographs show the distribution of cells in the BNSTa (I; BSTMA; arrows indicate the regions particularly stained in N mice) and the CST (J; surrounded by the LSV and the ADP). Stereological counting (cells per cubic millimeter ± SEM) revealed a significant change in the BNSTa located between AP +0.5 and +0.4 mm (volume, 0.071 ± 0.002 mm3;p < 0.05; F) but not in the CST located between AP +0.1 and −0.2 mm (volume, 0.131 ± 0.001 mm3; G).
Fig. 5.
Fig. 5.
Data showing the greater density of staining in amygdalo-striatal areas of N versus S mice. Virtual sections show the distribution of cells in the basomedial and central amygdala (BMA, Ce;A), the lateral and the basolateral amygdala (La, BLA;C), the medial amygdala anterior (MeA;E), and the ventral and dorsal portion of the medial amygdala posterior (MePV, MePD; K). The microphotograph in D shows the dense cluster of cells at the boundary of the anterior cortical nucleus (ACo) and the MeA. Unframed images for each pair are from N mice; black-framed images are from S mice. Stereological counting (cells per cubic millimeter ± SEM) revealed significant changes in the BMA located between AP −0.7 and −1.5 mm (volume, 0.273 ± 0.003 mm3;p < 0.05; B), the MeA located between AP −0.6 and −1.3 mm (volume, 0.129 ± 0.002 mm3; p < 0.01;F), and the MePV and ACo located between AP −0.9 and 2.1 mm (volume, 0.424 ± 0.009 mm3;p < 0.01; I).L, There was no significant change in Ce located between AP −0.8 and −1.5 mm (volume, 0.259 ± 0.006 mm3). The other virtual sections show the distribution of cells in the dorsomedial portion of the caudate putamen (CPu; G), the posterior portion of the CPu (H), and the nucleus accumbens (Acb;J [notice in N mice the higher density in the shell compared with the core of the accumbens (AcbSh, AcbC)]. Stereological counting (cells per cubic millimeter ± SEM) revealed significant changes in M) the mediodorsal CPu located between AP +0.0 and −1.2 mm (volume, 0.768 ± 0.057 mm3;p = 0.01; M), the posterior CPu and the Astr located between AP −1.0 and −2.0 mm (volume, 0.693 ± 0.039 mm3; p = 0.05; N), and the Acb located between AP +1.7 and +1.3 mm (volume, 0.645 ± 0.019 mm3;p < 0.01; O).
Fig. 6.
Fig. 6.
Evidence for greater activity in cingulate and dorsal prefrontal cortices of N versus S mice. Photomicrographs show the differential activity in A) the granular and agranular layers of the retrosplenial cortex (RSG, RSA; A), areas 1 and 2 of the anterior cingulate cortex (Cg1, Cg2; B), and the prelimbic cortex and the most rostral part of the anterior cingulate cortex (PrL, Cg1; C [no change in the adjacent nose component of the motor cortex (M2)]. Unframed images for each pair are from N mice; black-framed images are from S mice. Stereological counting (cells per cubic millimeter ± SEM) shows an enhancement in cortical activity in N versus S mice. Student's ttests indicated significant effects in the granular retrosplenial cortex located between AP −1.8 and 2.7 mm (volume, 0.280 ± 0.011 mm3; p < 0.05;D), Cg2 located between AP +0.1 and −0.7 mm (volume, 0.168 ± 0.005 mm3; p < 0.05; E), Cg1 located between AP +2.1 and +1.6 mm (volume, 0.260 ± 0.008 mm3;p < 0.01; F), and PrL located between AP +2.1 and +1.6 mm (volume, 0.277 ± 0.006 mm3; p < 0.05;G).
Fig. 7.
Fig. 7.
Cross-sectional diagram of the forebrain summarizing the results of the present study. Areas of preferential activity in N and S mice are indicated in blue and red, respectively, with the color brightness representing the approximate intensity of the differences. Areas showing strong but equal c-fos expression in both N and S mice are omitted for clarity (see on-line Table 1, available atwww.jneurosci.org). See Results for details. An animated three-dimensional version of this summary diagram can be seen in on-line Appendix B.
Fig. 8.
Fig. 8.
Hypothetical circuit illustrating the interactions between brain areas leading to either A) motile defense (A) or immobile defense (B). C, Septal and hypothalamic nuclei believed to be involved in behavioral inhibition in the context of other known functional columns. A, A stream of activity in motor programming cortical areas (e.g., Cg, RS, and PrL) and amygdalo-striatal motor regions would trigger motile defense via the mesencephalic motor pattern initiators (e.g., PAG, CnF, and PPTg). A putative positive feedback loop (blue arrows) from the motor programming cortical areas to the dorsolateral posterior hypothalamic zone (PH, LH) may maintain activity in the septal VDB, which in turn could limit behavioral inhibition through is inhibitory projections to the LSV (blunt arrows). The LSV could also be inhibited via projections from the medial amygdala. B, The LSV would inhibit flight by suppressing activity in the VDB. This inhibition could be reinforced by positive feedback interactions with hypothalamic nuclei of the medial periventricular zone (red arrows; e.g. ADP, MPO, and Pa). This hypothalamic zone could also independently inhibit areas subserving motile defense through direct and indirect projections (blunt arrows). The lateral septum, through descending GABAergic projections, could also decrease the activity of the dorsolateral posterior hypothalamic zone. C, Regions of the medial periventricular zone of the hypothalamus and the LSV are extensively interconnected (red represents pathways predominantly active in S mice). Black represents areas involved in defense and that have equal but moderate to intense c-fos activity in both groups. Light gray represents adjacent hypothalamic areas, involved in sexual behaviors, which displayed low activity to the aversive ultrasound. All these hypothalamic zones control behaviors through their projections to the PAG or the amygdala. The LSV, via the hypothalamus, is also likely to modulate the release of stress factors such as CRH, which induce c-fos activity in the LSV.

References

    1. Alheid GF, Olmos JS, Beltramino CA. Amygdala and extended amygdala. In: Paxinos G, editor. The rat nervous system. Academic; San Diego: 1995. pp. 495–578.
    1. Anokhin KV, Mileusnic R, Shamakina IY, Rose SP. Effects of early experience on c-fos gene expression in the chick forebrain. Brain Res. 1991;544:101–107. - PubMed
    1. Bandler R, Keay KA, Floyd N, Price J. Central circuits mediating patterned autonomic activity during active vs. passive emotional coping. Brain Res Bull. 2000;53:95–104. - PubMed
    1. Beckett SR, Aspley S, Graham M, Marsden CA. Pharmacological manipulation of ultrasound induced defence behaviour in the rat. Psychopharmacology. 1996;127:384–390. - PubMed
    1. Blanchard DC, Griebel G, Blanchard RJ. Mouse defensive behaviors: pharmacological and behavioral assays for anxiety and panic. Neurosci Biobehav Rev. 2001;25:205–218. - PubMed

Publication types

MeSH terms

Substances

LinkOut - more resources