. 2003 May 1;23(9):3881-98.
doi: 10.1523/JNEUROSCI.23-09-03881.2003.

Electrophysiological imaging of functional architecture in the cortical middle temporal visual area of Cebus apella monkey

Affiliations

Electrophysiological imaging of functional architecture in the cortical middle temporal visual area of Cebus apella monkey

Antonia Cinira M Diogo et al. J Neurosci. .

Abstract

We studied the spatial organization of directionally selective neurons in the cortical middle temporal visual area (area MT) of the Cebus monkey. We recorded neuronal activity from multielectrode arrays as they were stepped through area MT. The set of recording sites in each array penetration described a plane parallel to the cortical layers. At each recording site, we determined the preferred direction of motion. Responses recorded at successive locations from the same electrode in the array revealed gradual changes in preferred direction, along with occasional directional reversals. Comparisons of responses from adjacent electrodes at successive locations enabled electrophysiological imaging of the two-dimensional pattern of preferred directions across the cortex. Our results demonstrate a systematic organization for directionality in area MT of the New World Cebus monkey, which is similar to that known to exist in the Old World macaque. In addition, our results provide electrophysiological confirmation of map features that have been documented in other cortical areas and primate species by optical imaging. Specifically, the tangential organization of directional selectivity is characterized by slow continuous changes in directional preference, as well as lines (fractures) and points (singularities) that fragment continuous regions into patches. These electrophysiological methods also allowed a direct investigation of neuronal selectivities that give rise to map features. In particular, our results suggest that inhibitory mechanisms may be involved in the generation of fractures and singularities.


Figures

Fig. 1.
Fig. 1.
Schematic comparison of EI and OI.A, Multielectrode arrays used for EI. The array shown at left contains six electrodes spaced 700 μm apart. The array shown at right contains 11 electrodes that lie in two parallel interdigitating planes, which permits recordings spaced at 350 μm relative to cortical laminas. B, Left, Electrophysiological imaging. Electrodes are moved simultaneously through a region of cortex, stopping at predetermined positions (e.g., every 200 μm). At each position, neuronal responses to a specific set of stimulus conditions (e.g., different directions of stimulus motion) are recorded. The recording sites at each point in time (small gray circles) thus describe a line (1 row). After the electrode array has crossed the cortical region, the set of recording sites describes a plane, rows of which have been sampled at sequential points in time. The sampling resolution of the matrix of neuronal tuning data is determined by the distance between electrodes in the array (columns in this figure) and the distance between positions of the array (rows in this figure) as it is advanced through the cortex. Spatial and temporal sampling resolutions for the data obtained from the present application of EI are indicated below the EI array. B, Right, Optical imaging. This more conventional technique obtains the entire tuning matrix at a single point in time. Spatial and temporal sampling resolutions for typical OI applications are indicated below the OI array. As implemented, the two methods also differ in spatial resolution (OI is greater), temporal resolution (EI is greater), and signal source (electrophysiological, extracellular action potentials; vs optical, membrane potential). T1, First recording in a given multiple electrode penetration; Tn, last recording.
Fig. 2.
Fig. 2.
Representative data for reconstruction of electrode array penetrations from one animal (monkey B) that was studied via qualitative RF measurements. Inset, Top left, A lateral view of the brain along with the angle (28° posterior to the frontal plane) and positions of the serial sections from which electrode penetrations were reconstructed. Scale bar, 5 mm. Insets, Top right, Tracings of four representative serial sections are shown at the top right for reference. Scale bar, 5 mm. The portion of each section highlighted by a rectangle is illustrated as a photomicrograph at bottom. A–D, These sections were spaced at 0.4 mm intervals and stained for myelin using the Gallyas (1979) method. The ring of cortical tissue in the bottom right of each photomicrograph is the lower posterior extent of the superior temporal sulcus, which appears as an invagination in this plane of section. Area MT can be identified by dense myelination along the upper portion of this ring of cortical tissue; the boundaries are indicated by arrows. Three microelectrode array penetrations were made in this animal in a plane approximately parallel to the plane of section. Two of these penetrations (P1 and P2) entered from the dorsal margin of the sections; the third penetration (P3) entered from the dorsolateral margin (30° lateral to the sagittal plane). Gliosis caused by each penetration appears at different dorsoventral levels in different sections because of a slight difference between the angle of penetration and the angle of section. The general trajectories of the three penetrations are indicated by white and black bars. One identified electrolytic lesion is indicated by an asterisk inC. Complete penetrations reconstructed from the full set of histological sections were used to identify the locations of all MT recording sites, which in turn were projected onto the cortical surface of area MT. (nota bene, Not all penetration landmarks are visible in the low-power photomicrographs used for this illustration.) Scale bar, 2 mm. ip, Intraparietal sulcus; ca, calcarine sulcus; D, dorsal; L, lateral. (See Fig. 7.)
Fig. 3.
Fig. 3.
Representative data for reconstruction of electrode array penetrations from one animal (monkey E) that was studied via quantitative RF measurements. Inset, Top left, A lateral view of the brain along with the angle (20° posterior to the frontal plane) and the positions of serial sections from which electrode penetrations were reconstructed. The electrode array penetrations were made at an angle of 12° posterior to the frontal plane, which is indicated schematically by the wide black bars on the brain at top left. Scale bar, 5 mm. Insets, Top right, Tracings of four representative serial sections (A–D) are shown at the top right for reference. Scale bar, 2 mm. The portion of each section highlighted by a rectangle is illustrated as a photomicrograph at bottom. A–D, These sections were spaced at 0.4 mm intervals and stained for myelin using the Gallyas (1979) method. The ring of cortical tissue in the bottom center of each photomicrograph is the lower posterior extent of the superior temporal sulcus. Area MT appears along the upper portion of this ring of cortical tissue; the boundaries are indicated by arrows. Three microelectrode array penetrations (P1, P2, and P3) were made in this animal, and they entered from the dorsal margin of the sections. Gliosis caused by each penetration appears at different dorsoventral levels in different sections because of the difference between the angles of penetration and section. D also contains gliosis caused by an oblique single-electrode penetration used to locate area MT, which is visible at the level of the cortical surface medial to the path of the multielectrode array. The general trajectories of the three multielectrode penetrations are indicated by black bars (P1) or white bars (P2, P3). One identified electrolytic lesions is indicated by an asterisk in D. Complete penetrations reconstructed from the full set of histological sections were used to identify the locations of all area MT recording sites, which in turn were projected onto the cortical surface of area MT. (nota bene, Not all penetration landmarks are visible in the low-power photomicrographs used for this illustration.) (See Fig. 9.)
Fig. 4.
Fig. 4.
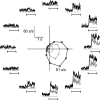
Neuronal activity elicited from a typical unidirectional multiunit cluster in area MT. The RF was located in the lower visual field quadrant contralateral to the recorded hemisphere and within 10° of the center of gaze. Visual stimuli consisted of gratings and dot patterns that were each moved within the RF in each of 12 different directions. Peristimulus response histograms for gratings (gray) and dots (black) are plotted around the perimeter of the figure with azimuth corresponding to the direction of motion. The bar under each histogram indicates the period of time in which the stimulus was moving in the RF. Individual histograms represent responses summed over 10 stimulus presentations. The polar graph at center represents the mean response rate for each direction, plotted separately for gratings (gray) and dots (black). The dashed circle indicates the level of spontaneous activity. Responses to gratings were characteristically weaker than those to moving dot patterns. Directional tuning bandwidths and indices of directionality were similar for the two stimulus types. s/s, Spikes per second; 1 s, 1 sec.
Fig. 5.
Fig. 5.
Measures of directional tuning from selective multiunit recording sites in area MT. A, Distribution of directional tuning bandwidths in response to moving gratings, for all multiunit clusters studied quantitatively (i.e., monkeys D and E).B, Distribution of the index of directionality for the same stimulus conditions and neuronal sample as in A.C, Distribution of preferred directions of motion obtained from all recording sites for which a preferred direction could be determined. Data were obtained from all animals, using moving gratings or bars as visual stimuli. The distribution exhibits a slight but significant bias centered on 180° (χ2 = 20.3; df = 11; p < 0.041). D, Distribution of changes in preferred direction between all pairs of successive recording sites for which a preferred direction could be determined, along all electrodes in all animals. The distribution is bimodal, with one peak (0–45°) reflecting gradual changes in preferred direction and another smaller peak reflecting directional reversals (135–180°).
Fig. 6.
Fig. 6.
Comparison of preferred directions of motion determined using moving gratings versus moving dots. Each point in the scatter plot represents the grating (y-axis) and dot (x-axis) preferred directions for one recording site. The plot contains data from all sites for which both measures could be determined reliably (n = 292). A line with unit slope is plotted for reference. The proximity of data points to this line indicates that the two measures were similar for most recording sites and were highly correlated (circular correlation coefficient = 0.405; p < 0.02).
Fig. 7.
Fig. 7.
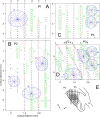
A–D, Two-dimensional maps of preferred axis of motion derived from qualitative RF measurements obtained along three multielectrode array penetrations (P1, P2, and P3) in monkey B. E, Line drawings of serial sections sliced in the plane of array penetrations, on which the boundaries of MT and the paths of electrodes are indicated. The trajectories of these multielectrode penetrations are shown in greater detail in Figure 2.A, A rectangular expanse of MT parallel to the cortical surface, on which the locations of P1 recording sites have been projected. The six electrodes of the array (a–f) entered this rectangular panel (and all others, except where noted otherwise) from its upper margin at 700 μm spacing. Preferred axis of motion at each recording site is indicated by a small bar. Elongated rectangles (green) highlight map features evident from each electrode considered individually, which consist of smooth progressions (e.g., L1, L2, L3) of preferred axis of motion (sequence regularity). Ellipses (blue) show radial arrangements (e.g., R1) or pinwheels that emerged from recording sites within and between adjacent electrodes. Stars indicate the locations of pandirectional recording sites. B,C, Data from arrays P2 and P3, respectively, and map features similar to those in A. D, A region of cortical tissue through which P2 and P3 traversed with overlapping trajectories (E, shaded rectangle). The P3 data in this panel are identical to those in C; the P2 data are drawn from the tilted rectangle (dotted line) inB. Recordings at regions of overlap between the two penetrations mostly corroborate selectivity measurements and map features, and they support the existence of additional map features that were not readily detectable from either data set alone. See also Figure 2.
Fig. 8.
Fig. 8.
Two-dimensional maps of preferred direction of motion derived from qualitative RF measurements obtained along three multielectrode array penetrations (P1, P2, and P3) in monkey B. These data correspond to the same cortical regions and recording sites as those in Figure 7. All plotting conventions are the same as in Figure7, except that preferred direction of motion is represented by the direction of a small arrow at each recording site. Red arrows are used to indicate the locations of pairs of recording sites for which preferred direction of motion shifted by ∼180° (i.e., a directional reversal). E, The section from Figure 7Ethat illustrates the P2–P3 overlap. The section has been rotated counterclockwise to emphasize its relationship to the data inD. See also Figure 2.
Fig. 9.
Fig. 9.
Single-condition map of normalized neuronal firing rates in the interpolated response matrix for a rectangular region of area MT in monkey E. Neuronal responses were sampled along a penetration of the 11-electrode array (see Materials and Methods). The stimulus was a grating that moved in direction 0° (rightward). Small arrows at the top indicate trajectories of the 11 electrodes in the array. Crosshairs indicate actual recording sites. Normalized firing rates are proportional to gray-scale values. Max, Maximum firing rate; min, minimum firing rate.
Fig. 10.
Fig. 10.
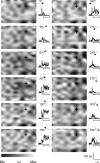
Set of 12 single-condition maps, each of which represents normalized neuronal firing rate as a function of position in the same rectangular region of area MT. Each map presents firing rates elicited by 1 of the 12 different directions of motion of a grating within the RF. The map at top left (direction 0°) is the same as that shown in Figure 9. To the right of each map appears a peristimulus response histogram for a unidirectional multiunit that was recorded from the site indicated by the crosshair in each map. (As indicated in Materials and Methods, stimulus motion was preceded by a brief static presentation of the stimulus, which often elicited a transient neuronal response, as was the case for this recording site.) Min, Minimum firing rate; max, maximum firing rate; ss, spikes per second; 1 s, 1 sec.
Fig. 11.
Fig. 11.
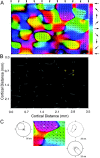
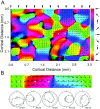
A, Color-coded composite map of the two-dimensional surface of area MT, which represents the preferred direction for a moving grating. These maps were computed by multiplying each of the 12 single-condition neuronal response maps shown in Figure 10 by a vector corresponding to the direction of stimulus motion and then taking the sum of the resulting vector matrices (see Materials and Methods). Small arrowheads at top indicate trajectories of the 11 electrodes in the array. Color code for preferred direction of motion appears along the right margin of the map. Arrows overlaid on the color map are a subsampled vector description of local directional preference; arrow direction represents the preferred direction (redundant with color code), and relative length reflects the strength of selectivity. Dark regions of the color-coded map indicate areas for which measurements were deemed unreliable, as calculated by a bootstrap algorithm. B, Directional preference discontinuities (fractures and singularities) in the composite map of A can be identified in the 2D gradient map, which illustrates the rate of change of preferred direction. The map was computed using the gradient transform (bright denotes high rate of change). Thus, the bright areas correspond to regions at which preferred direction underwent a sharp transition.C, Magnified view of a directional discontinuity (fracture) present in the top-right region of the map shown inA. This fracture extends from bottom left to top right and is most evident from the red/green transition. The three crosshairs (also shown in A and B) indicate the locations of three recording sites that span the fracture. Directional tuning curves obtained at these three sites are illustrated in polar format. Indicated spike rates correspond to the scale of the outer circle in each plot. Broken circles indicate spontaneous activity level. The tuning curve at top left corresponds to the recording site highlighted in Figure 10. The tuning curve at bottom right shows a recording on the opposite side of the fracture, which was selective for the opposite direction of motion. The remaining recording site (top right) is located very near the fracture, and the tuning curve shows that its directional preference was primarily shaped by inhibition.
Fig. 12.
Fig. 12.
A, Color-coded composite map of the two-dimensional surface of area MT, which represents the preferred direction for a moving dot stimulus. This map is coextensive with that of Figure 11A and is derived from the same recording sites. In comparison with Figure 11A, this map serves to illustrate the marked similarities between functional maps generated using moving dots versus moving gratings, which suggest that the directional preferences of area MT neurons inCebus are not substantially sensitive to the form of the moving stimulus. Map derivation and plotting conventions are the same as in Figure 11A.B, Magnified view of a strip of cortex drawn from the right-center portion of the map shown in A, in which the rate of change of preferred direction varied considerably. Much of this strip consists of gradual shifts in preferred direction, which were interrupted by two directional fractures (identifiable by the thin yellow and purple bands). The five white crosshairs indicate the locations of recording sites that are within regular sequences and span fractures. Directional tuning curves obtained at these five sites are illustrated at the bottom. Tuning curves are illustrated in polar format. Spike rates (s/s) correspond to the scale of the outer circle in each plot. Broken circles indicate spontaneous activity level. The two sites nearest the two fractures (first and third from left) exhibited directional tuning that was shaped primarily by inhibition. In contrast, sites in the midst of smooth sequences exhibited highly excitatory responses and were unidirectional. s/s, Spikes per second.
Fig. 13.
Fig. 13.
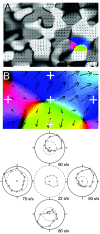
Illustration of neuronal responses that gave rise to a pinwheel map formation. A, Miniaturized reproduction of preferred direction map (dot stimulus) from Figure12A, which illustrates the location of the map region highlighted in B. B, Magnified view of a rectangular region of cortex extracted from map inA, which illustrates a pair of directional singularities (at center and bottom right) with corresponding pinwheel formations, which are linked by a fracture. Each pinwheel is composed of a half-rotation (180°) and a fracture. White crosshairs indicate the locations of five recording sites, which include a site near the pinwheel center and four sites around the perimeter. Directional tuning curves obtained at these sites are illustrated at bottom in polar format. Spike rates (s/s) correspond to the scale of the outer circle in each plot. Broken circles indicate spontaneous activity level. The central site exhibited a weak form of directional tuning that was shaped entirely by inhibition. The remaining sites were excitatory and unidirectional.
Fig. 14.
Fig. 14.
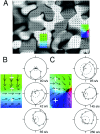
Illustration of neuronal responses associated with linear and radial progressions of preferred direction of motion.A, Miniaturized reproduction of preferred direction map from Figure 12A, which illustrates the locations of map regions highlighted in B and C.B, Magnified view of a rectangular region of cortex extracted from lower central region of map in A, which illustrates a smooth linear progression of preferred direction of motion. White crosshairs indicate the locations of three recording sites along this progression. Directional tuning curves obtained at these three sites are illustrated at right in polar format. Spike rates (s/s) correspond to the scale of the outer circle in each plot. Broken circles indicate spontaneous activity level. All three recording sites exhibited strong unidirectional responses. C, Magnified view of a rectangular region of cortex extracted from rightward region of map in A, which illustrates another smooth progression of preferred direction of motion. White crosshairs indicate the locations of three recording sites along different radial axes. Directional tuning curves obtained at these three sites are illustrated at right in polar format. All three recording sites exhibited strong unidirectional responses.
Fig. 15.
Fig. 15.
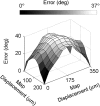
Estimated error in the interpolation of preferred direction of motion as a function of 2D map position within the sampling region bounded by measured map values. Each small square (35 × 20 μm) represents the SD of the error distribution at all equivalent positions in the directional maps shown in Figures11A and 12A. The interpolation error was naturally zero at the recording sites. The error estimate reached its largest value (37°) at the maximum distance from the recording sites. The average interpolation error was 24°. Gray-scale values are proportional to interpolation error; lighter areas represent larger errors. See Materials and Methods for the interpolation error analysis procedure.

References

    1. Albright TD. Direction and orientation selectivity of neurons in visual area MT of the macaque. J Neurophysiol. 1984;52:1106–1130. - PubMed
    1. Albright TD. Centrifugal directional bias in the middle temporal visual area (MT) of the macaque. Vis Neurosci. 1989;2:177–188. - PubMed
    1. Albright TD, Desimone R. Local precision of visuotopic organization in the middle temporal area (MT) of the macaque. Exp Brain Res. 1987;65:582–592. - PubMed
    1. Albright TD, Desimone R, Gross CG. Columnar organization of directionally selective cells in visual area MT of the macaque. J Neurophysiol. 1984;51:16–31. - PubMed
    1. Batschelet E. Circular statistics in biology. Academic; London: 1981.

Publication types

LinkOut - more resources