Comparative Study
. 2003 May 9;4(1):19.
doi: 10.1186/1471-2164-4-19. Epub 2003 May 9.

Development and validation of a T7 based linear amplification for genomic DNA

Affiliations
Comparative Study

Development and validation of a T7 based linear amplification for genomic DNA

Chih Long Liu et al. BMC Genomics. .

Abstract

Background: Genomic maps of transcription factor binding sites and histone modification patterns provide unique insight into the nature of gene regulatory networks and chromatin structure. These systematic studies use microarrays to analyze the composition of DNA isolated by chromatin immunoprecipitation. To obtain quantities sufficient for microarray analysis, the isolated DNA must be amplified. Current protocols use PCR-based approaches to amplify in exponential fashion. However, exponential amplification protocols are highly susceptible to bias. Linear amplification strategies minimize amplification bias and have had a profound impact on mRNA expression analysis. These protocols have yet to be applied to the analysis of genomic DNA due to the lack of a suitable tag such as the polyA tail.

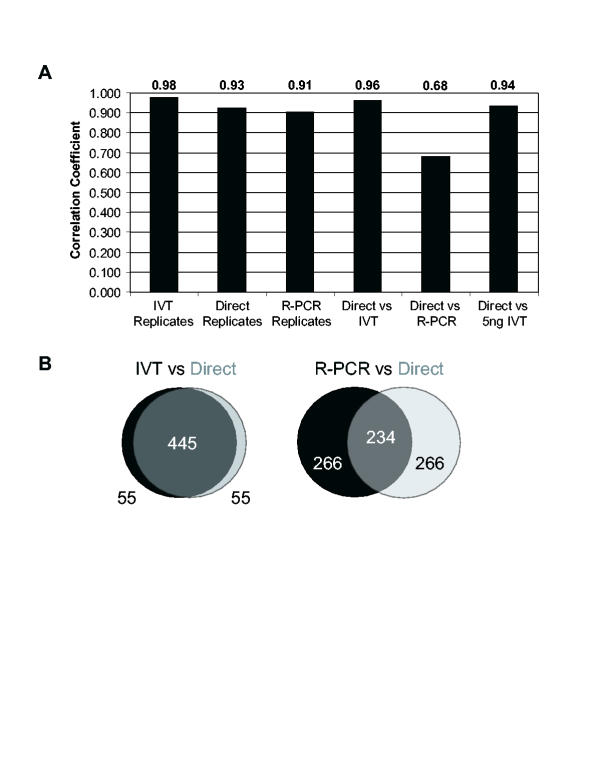
Results: We have developed a novel linear amplification protocol for genomic DNA. Terminal transferase is used to add polyT tails to the ends of DNA fragments. Tail length uniformity is ensured by including a limiting concentration of the terminating nucleotide ddCTP. Second strand synthesis using a T7-polyA primer adapter yields double stranded templates suitable for in vitro transcription (IVT). Using this approach, we are able to amplify as little as 2.5 ng of genomic DNA, while retaining the size distribution of the starting material. In contrast, we find that PCR amplification is biased towards species of greater size. Furthermore, extensive microarray-based analyses reveal that our linear amplification protocol preserves dynamic range and species representation more effectively than a commonly used PCR-based approach.

Conclusion: We present a T7-based linear amplification protocol for genomic DNA. Validation studies and comparisons with existing methods suggest that incorporation of this protocol will reduce amplification bias in genome mapping experiments.


Figures

Figure 1
Figure 1
Linear amplification scheme for genomic DNA. Step 1: Double stranded DNA starting material (shown with one strand in black and one strand in blue) is tailed on the 3' end of each strand to generate a 20–40 bp polyT tail with a terminal dideoxycytidine base. Step 2a: A T7-(A)18B anchored primer adaptor is annealed to the polyT tail of each template strand. Step 2b: During second strand synthesis Klenow fragment of DNA Polymerase I removes the excess bases from the tail overhang via its 3'-5' exonuclease activity, and extends from the primer to produce the second strand. This results in two double stranded DNAs identical to the original template, except that each has a T7 promoter at a different end. Step 3: The product of second strand synthesis is used as template in an in vitro transcription reaction. Step 4: To generate DNA probes for microarray analysis, amplified RNA is reverse transcribed.
Figure 2
Figure 2
Size distributions for starting material and IVT amplified product. Lanes 1–3 each contain 250 ng DNA run on a 2% non-denaturing agarose gel. Lanes 4–5 each contain 500 ng RNA run on a 2% denaturing agarose gel. The denaturing gel is necessary to eliminate RNA secondary structure. Lane 1: 100 bp ladder (NEB). Lane 2: starting material (yeast genomic DNA digested with Alu I and previously gel-purified to a size range of 100–700 bp). Lane 3: amplified product generated by R-PCR from 50 ng starting material. Lane 4: amplified RNA product generated by IVT from 50 ng starting material. Lane 5: 100 bp RNA Ladder (Ambion). The R-PCR amplified product appears to significantly under-represent low molecular weight species. The IVT amplified product may slightly under-represent high molecular weight species. For clarity, the denaturing gel image was rescaled to match the ladder of the non-denaturing gel.
Figure 3
Figure 3
Comparisons of microarray data collected using direct labeling, IVT or R-PCR methods. (A) Bar graph showing correlations between replicates collected using the same protocol, and between the averaged datasets determined using different protocols. (B) Venn diagrams showing overlap between sets of features with the highest Cy5/Cy3 ratios.
Figure 4
Figure 4
Scatter plots of hybridization ratios. IVT ratios (A) or R-PCR ratios (B) are plotted against direct labeling (unamplified) ratios. The tight distribution of points along the fitted line in (A) illustrates the high fidelity of the IVT amplification.
Figure 5
Figure 5
Hierarchical clustering of replicate datasets generated by direct labeling, IVT and R-PCR. Each thin bar represents a single datapoint. Red bars correspond to enrichment in the Cy5-labeled Alu I probe, while green bars correspond to enrichment in the Cy3-labeled Rsa I probe. The dendrograms (top) indicate clustering relationships among the sample replicates. The lengths of the branches represent the degree of similarity between the samples (shorter indicates higher similarity). Purple stripes to the right of the diagram highlight discordant areas (log ratios with opposite signs) in the R-PCR replicates relative to the direct labeling and IVT samples.

References

    1. DeRisi JL, Iyer VR, Brown PO. Exploring the metabolic and genetic control of gene expression on a genomic scale. Science. 1997;278:680–6. doi: 10.1126/science.278.5338.680. - DOI - PubMed
    1. Wodicka L, Dong H, Mittmann M, Ho MH, Lockhart DJ. Genome-wide expression monitoring in Saccharomyces cerevisiae. Nat Biotechnol. 1997;15:1359–67. - PubMed
    1. Ramaswamy S, Golub TR. DNA microarrays in clinical oncology. J Clin Oncol. 2002;20:1932–41. - PubMed
    1. Ren B, Robert F, Wyrick JJ, Aparicio O, Jennings EG, Simon I, Zeitlinger J, Schreiber J, Hannett N, Kanin E, et al. Genome-wide location and function of DNA binding proteins. Science. 2000;290:2306–9. doi: 10.1126/science.290.5500.2306. - DOI - PubMed
    1. Iyer VR, Horak CE, Scafe CS, Botstein D, Snyder M, Brown PO. Genomic binding sites of the yeast cell-cycle transcription factors SBF and MBF. Nature. 2001;409:533–8. doi: 10.1038/35054095. - DOI - PubMed

Publication types

MeSH terms

LinkOut - more resources