. 2003 Jul 25;278(30):27844-52.
doi: 10.1074/jbc.M304522200. Epub 2003 May 11.

M phase phosphoprotein 1 is a human plus-end-directed kinesin-related protein required for cytokinesis

Affiliations

M phase phosphoprotein 1 is a human plus-end-directed kinesin-related protein required for cytokinesis

Aouatef Abaza et al. J Biol Chem. .

Abstract

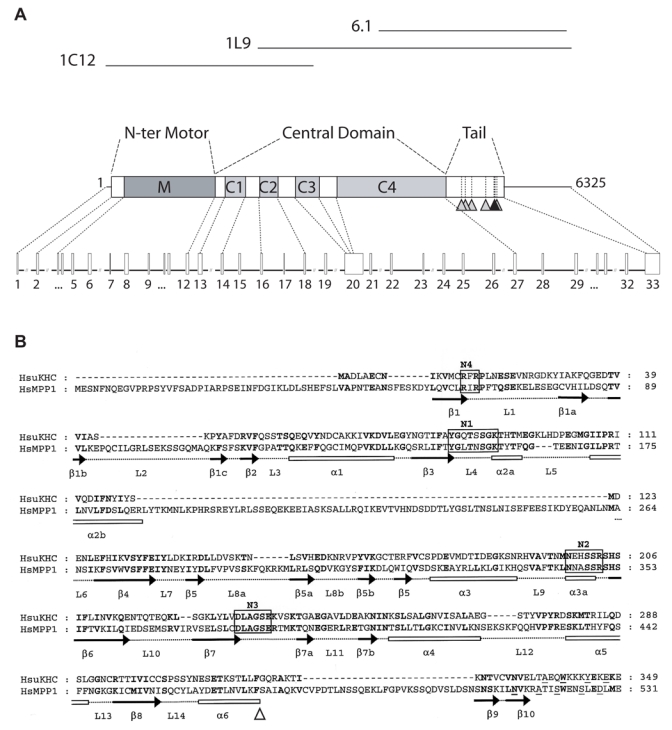
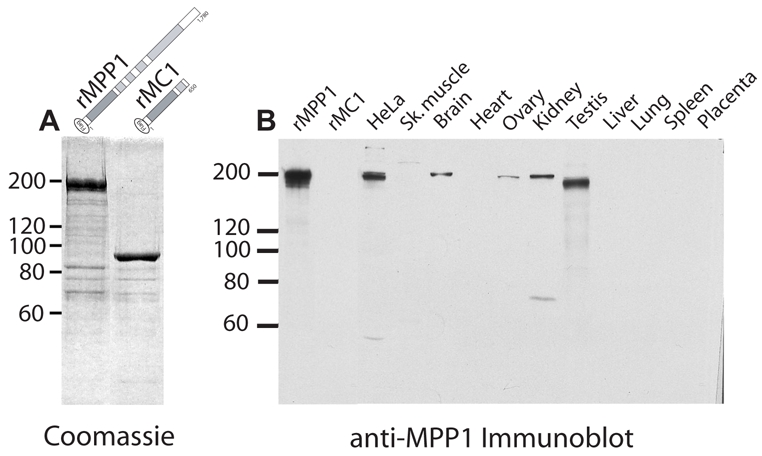
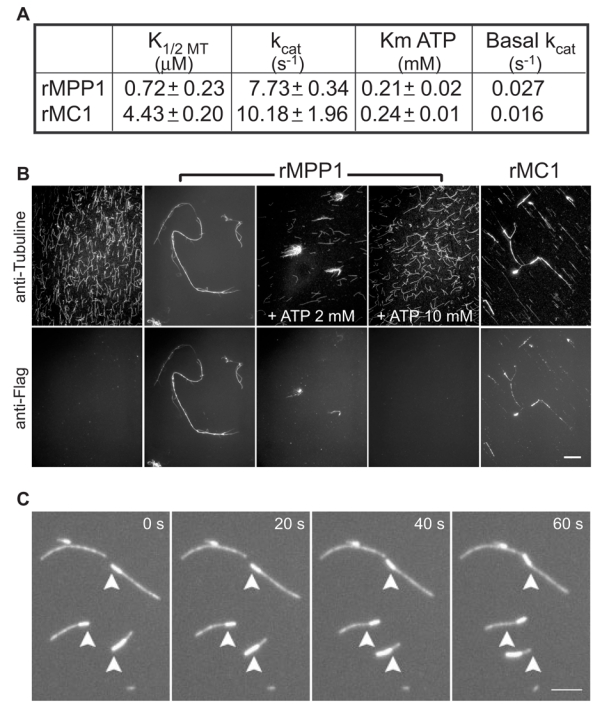
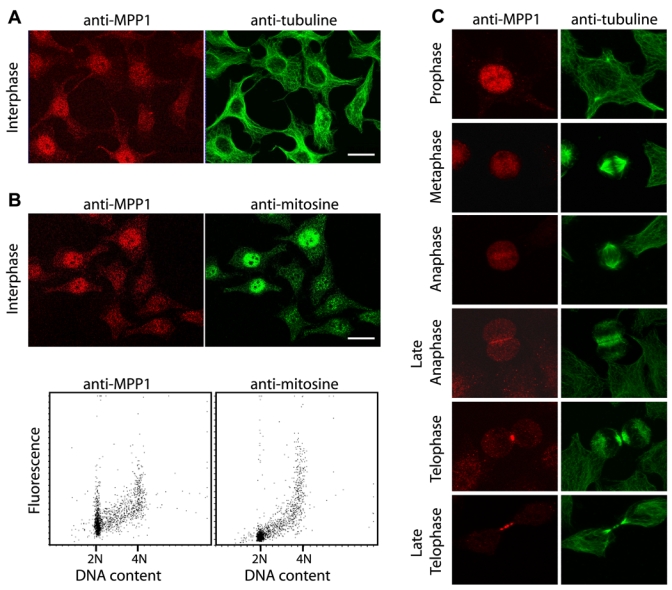
The human M phase phosphoprotein 1 (MPP1), previously identified through a screening of a subset of proteins specifically phosphorylated at the G2/M transition (Matsumoto-Taniura, N., Pirollet, F., Monroe, R., Gerace, L., and Westendorf, J. M. (1996) Mol. Biol. Cell 7, 1455-1469), is characterized as a plus-end-directed kinesin-related protein. Recombinant MPP1 exhibits in vitro microtubule-binding and microtubule-bundling properties as well as microtubule-stimulated ATPase activity. In gliding experiments using polarity-marked microtubules, MPP1 is a slow molecular motor that moves toward the microtubule plus-end at a 0.07 microm/s speed. In cycling cells, MPP1 localizes mainly to the nuclei in interphase. During mitosis, MPP1 is diffuse throughout the cytoplasm in metaphase and subsequently localizes to the midzone to further concentrate on the midbody. MPP1 suppression by RNA interference induces failure of cell division late in cytokinesis. We conclude that MPP1 is a new mitotic molecular motor required for completion of cytokinesis.


Figures

Fig. 1
Fig. 1. Structural organization of human MPP1
A. Human MPP1 cDNA representation and genomic organization. The three cDNAs 6-1, 1L9 and 1C12 that were cloned as detailed under Experimental procedures are drawn as thin lines above the schematic representation of the full-length MPP1 cDNA. Horizontal lines indicate 5′ and 3′-untranslated regions. The enlarged 70–5412 sequence encodes a kinesin family member, 1,780 amino acid residues long whose predictive mass is 206,187. It exhibits a conserved organization into three regions (15). The dark grey box (M), which corresponds to the hyper-conserved motor domain, indicates that MPP1 is an NH2-terminal motor. In the central region, four α-helical domains (C1 to C4) shown in light grey are predicted to form coiled-coil conformations as determined by the program of Lupas et al (75). The tail region, which is supposed to interact with cargos, exhibits five putative MPM2-recognition sites and one presumptive NLS as indicated with grey and black triangles (24,76). No putative PEST and cyclin or DNA-binding domains sequences were found. HsMPP1 is identical to the recently described KRMP1 found independently by another laboratory and the hypothetical protein CAB55962, with the exception of 9 and 2 aa, respectively (46,77). The very high sequence identity suggests that the same gene encodes them all. The human genomic MPP1 locus (gb AL 157389) was identified using the MPP1 cDNA as a query in the Blast algorithm against the human genome database. The intron-exon boundaries were defined by direct comparison of the cDNA sequence against the genomic sequence. The corresponding exonintron structure of the human MPP1 gene is shown below with exons as numbered boxes and introns as connecting lines. B. Comparison of MPP1 and conventional KHC motor domains. Sequences of the first 550 and 350 amino acids of MPP1 and HsuKHC (sp P33176) were aligned using the Blast 2 sequences program. Sequences are 40% similar with 25% identity. Conserved residues are in bold and the positions of secondary structure elements are indicated according to KHC crystallographic data (39,40). The four conserved motifs, which interact with ATP, are drawn as boxes N1–4 as defined by Sablin et al (78). The open triangle indicates the limit between the KHC motor core domain and its neck region, which consists of β9 and β10 strands and a weak coiled-coil region extending at aa 352 (79). The heptad repeat positions predicted by Coils are underlined.
Fig. 2
Fig. 2. Purification of recombinant MPP1 mutants and immunoblot analysis of MPP1 distribution in various human tissues
A. Preparation of recombinant full-length protein and MC1 mutant. Recombinant full-length MPP1 protein, rMPP1, or the deletion mutant rMC1 (aa 1–650), which contains the putative motor domain and the first α-helical domain C1, were synthesized as FLAG-tagged fusion proteins and purified to near homogeneity from insect cells as described under Experimental procedures. They were run on an 8% PAGE-SDS gel and stained by Coomassie. rMPP1 migration corresponds to the predicted size of MPP1 and to its previously identified apparent molecular mass (1). On the other hand, rMC1 migrates anomalously large with an apparent MW ~15 kDa larger than MW calculated, suggesting an elongated form of the mutant. A schematic representation of the two constructs is drawn. B. Immunoblot of recombinant MPP1 mutants and of various human cell and tissues extracts. Tissue homogenates were aliquots of Clontech’s human protein medleys. Recombinant proteins (10 ng) or extracts (20 μg) were run on 8% PAGE-SDS gel, transferred to Immobilon P (Amersham) in the presence of 0.01% SDS and immunoreacted with an affinity-purified anti-MPP1 antibody (0.5 μg/ml) prepared as described under Experimental procedures. ECL substrat (Amersham) was used for detection. Lack of reactivity with rMC1 mutant indicates that we selected antibodies, which recognize epitopes present in the C2 to tail domains, the most specific portion of the protein when compared to other KLPs.
Fig. 3
Fig. 3. Activity of recombinant MPP1 and MC1
A. MT-activated ATPase activity. ATPase activities of the two fragments were assayed as described under Experimental procedures. Reactions were started by addition of the protein, 25 nM rMPP1 or 66 nM rMC1. K1/2 MT was measured in presence of 2 mM Mg- ATP, using MT ranging from 0.1 to 10 μM and maximum kcat was indicated. Km for ATP was determined in presence of 2 μM taxol-stabilized MTs, using Mg-ATP concentrations ranging from 0.025 to 4 mM. A similar assay using 250 nM MPP1 or 320 nM MC1 with 2 mM ATP in absence of MTs allowed measuring of MT-independent basal ATPase activity. Data represent the results from the two best motor preparations and mean values are shown with the SEM. B. Nucleotide-dependent promotion of MT bundling in vitro. rMPP1 and rMC1 were incubated with taxol-stabilized MTs in the presence or in the absence of ATP. The reactions were diluted in a fixative medium and sedimented onto glass coverslips. Tubulin and recombinant fragments were stained with specific antibodies. The upper panels show the distribution of MTs, lower ones the distribution of MPP1 mutants. Bar = 20 μm. C. rMC1 moves MTs with their minus end leading. Four frames from a time lapse fluorescence microscopy video of a rMC1-gliding assay using polarity-marked MTs at 30°C are shown. The starting position of the – end of the MT is indicated by the white arrowhead. Bar = 6 μm
Fig. 4
Fig. 4. Cell-cycle regulated MPP1 expression
A. MPP1 localizes mainly to the interphasic nuclei. HeLa cells were stained with the anti-MPP1 antibody (left panel) and an anti-β-tubulin monoclonal antibody (right panel) as described under Experimental procedures. Z Projections of confocal images are shown. Bar = 20 μm. B. MPP1 expression is increased in G2/M cells. Upper panels show confocal images of indirect immunofluorescence of HeLa cells stained with the anti-MPP1 (left) and antimitosin (right) antibodies. Lower panels show FACS analysis of HeLa cells stained with the same antibodies together with Hoechst and processed as described under Experimental procedures. C. MPP1 localizes to mitotic structures. HeLa cells were stained with the anti-MPP1 antibody (left panel) and anti-β-tubulin antibody (right panel) as in A.
Fig. 5
Fig. 5. Ectopic GFP-MPP1 localizes to the midbody
A. Level of GFP-MPP1 expression in a stable HeLa cell line. HeLa cells were stably transfected with a GFP-MPP1 construct as described under Experimental procedures. Similar amounts of untransfected (left lanes) or stably transfected cells (right lanes) were harvested and either boiled into SDS-PAGE sample buffer (upper panel) or immunoprecipitated (lower panel) with monoclonal anti-GFP antibodies (Boehringer Mannheim) as described by the manufacturer. Extracts were then analysed by immunoblot with the anti-MPP1 antibody. The signals of both MPP1 and GFP-MPP1 fusion protein that migrates at the predicted higher apparent MW are similar, indicating that the two proteins have similar levels of expression. B. Localization of exogenous GFP-MPP1 during cytokinesis. A telophasic cell was searched in the layer of GFP-MPP1 HeLa cells and time-lapse Z-sequences were collected and analyzed as described under Experimental procedures. As a rule 30 sequential Z-axis fluorescent images were collected in 0.3 μm steps, every 3 min. Selected frames of the timelapse epifluorescence microscopy videos were shown. Time for elongation and break of the midbody is indicated in min.
Fig. 6
Fig. 6. MPP1-depleted cells undergo cell death
A. Reduction of MPP1 levels after MPP1-specific siRNA transfection. HCT116 cells were transfected with buffer (Bu) or with siRNA homologous (siRNA1) or not homologous (siRNA1m or U) to MPP1, as described under Experimental procedures. Cells were harvested 24 h after transfection and subjected to immunoblot analysis with the anti-MPP1 antibody. siRNAs used are indicated above each lane. Specific targeting of MPP1 was demonstrated by the lack of reduction observed after use of mutated or unrelated sequences as well as buffer instead of the volume of siRNA1. Reprobing of the blot with an anti-tubulin antibody confirm equal loading of the samples (data not shown). B. Time course of change in cellular DNA content after siRNA transfection. Cells were transfected as above and analyzed by flow cytometry as described under Experimental procedures. Time after transfection (T) is in hours. Best results from three independently performed experiments are shown.
Fig. 7
Fig. 7. MPP1-depleted cells exhibit mitotic defects
A. Quantitation of cell progression phenotypes of control and MPP1-siRNA transfected cells. HCT116 cells were transfected as in Figure 6, transferred to live-cells chambers and three different fields were imaged every 5 min as described under Experimental procedures. Fifty to 60 cells were picked up randomly on the three images taken 18h after transfection and were followed until 54 h after transfection. HCT116 cells were scored for the various phenotypes observed in their cell cycle progression. When cells were dense, blebbing, with non-uniform membranes they were scored as apoptotic. Most of the cells become rounded and a well formed midbody between the two daughter cells appeared indicating that they were undergoing mitosis. When two viable daughter cells were formed, the cells were scored as going through successful mitosis. However, various defects in mitotic exit, daughter cells separation and further appearance of apoptosis were sometimes observed and the cells were then scored as undergoing failure of mitosis. In other cases, either mitosis or apoptosis were observed and we hypothesize that cells may be blocked. B. Cell cycle progression of control and MPP1-siRNA transfected cells. Selected frames of the time-lapse phase-contrast microscopy videos were shown: top row after transfection with siRNAU duplex, one typical control siRNA-transfected cell; middle and bottom rows after transfection with specific siRNA1 duplex, two typical siRNA1-transfected cells undergoing mitosis failure. The black arrow indicates the cell observed. m1 and m2 indicate entry into first or second mitosis, daughter cells are labelled with white arrows. Symbol marks (formula image
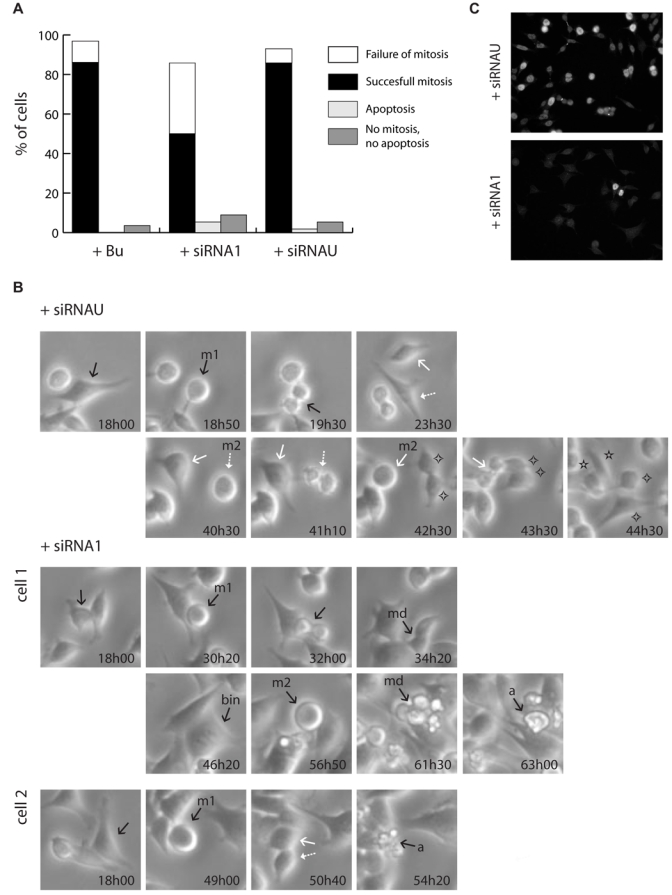
, ★) show daughter cells from the same mitotic cell. md indicates a mitotic defect, bin, a binucleated cell and a, an apoptotic cell. Time shown is in hours and min. C. MPP1 expression in siRNA-transfected cells. Indirect immunofluorescence of HCT116 cells stained with the anti-MPP1 antibody, 24 h after transfection with the indicated duplexes. The pattern obtained after siRNAU transfection is similar to the one after mockand siRNAi1m transfection (data not shown). As the cells were stained and the pictures acquired and processed under exactly the same conditions, this indicates that the level of transfection with siRNAi1 was very high and we can assume that the cells that we looked at in Fig 7B are actually transfected.

Similar articles

Cited by

References

    1. Matsumoto-Taniura N, Pirollet F, Monroe R, Gerace L, Westendorf JM. Mol Biol Cell. 1996;7:1455–1469. - PMC - PubMed
    1. Dustin PD. Microtubules. 2. Springer-Verlag; Berlin Heidelberg: 1984.
    1. Kirschner M, Mitchison T. Cell. 1986;45:329–342. - PubMed
    1. Murray AW, Kirschner MW. Science. 1989;246:614–621. - PubMed
    1. Lamb NJ, Fernandez A, Watrin A, Labbe JC, Cavadore JC. Cell. 1990;60:151–165. - PubMed

Publication types

MeSH terms