. 2003 May;89(5):2726-42.
doi: 10.1152/jn.00550.2002.

Space-time maps and two-bar interactions of different classes of direction-selective cells in macaque V-1

Affiliations

Space-time maps and two-bar interactions of different classes of direction-selective cells in macaque V-1

Bevil R Conway et al. J Neurophysiol. 2003 May.

Abstract

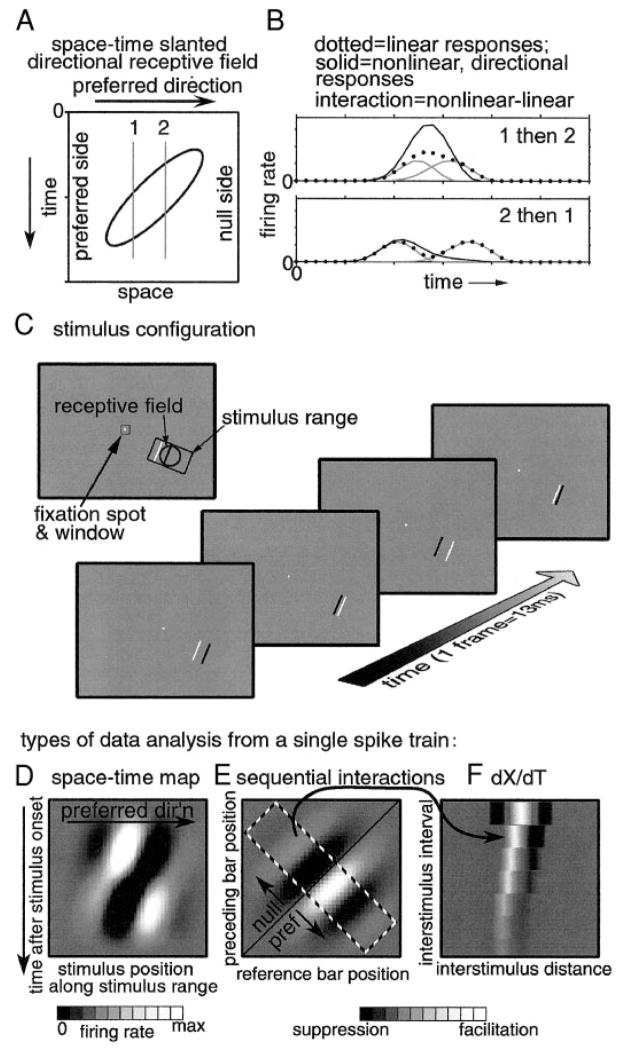
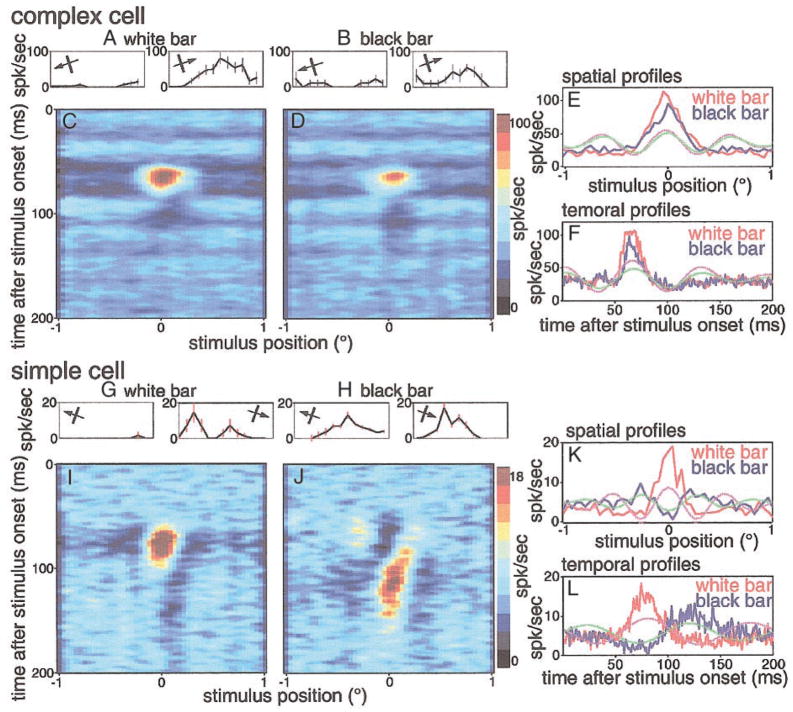
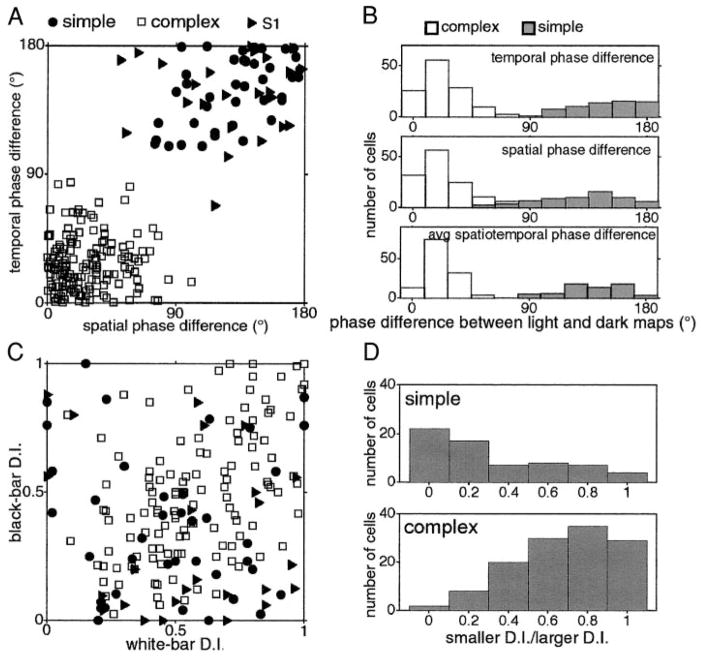
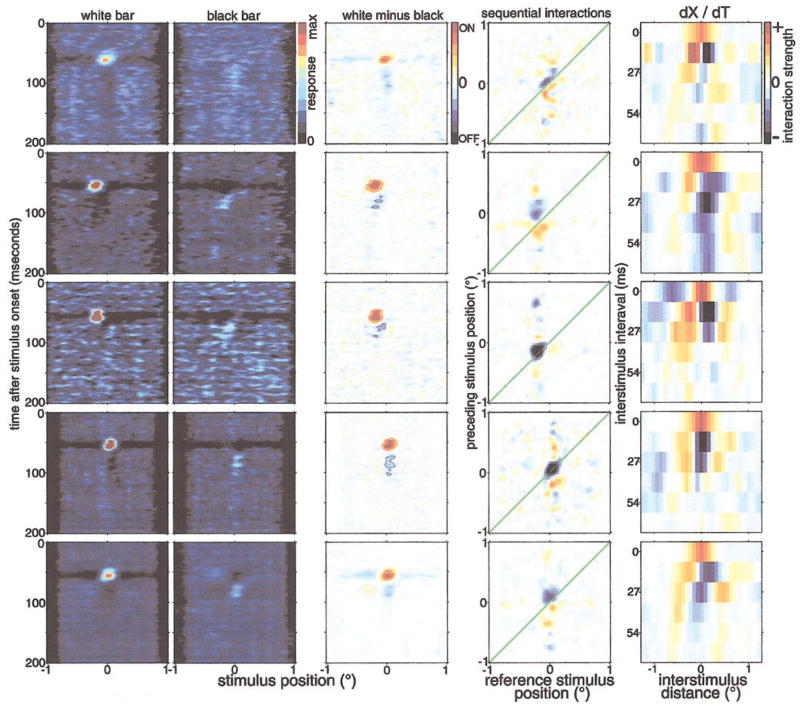
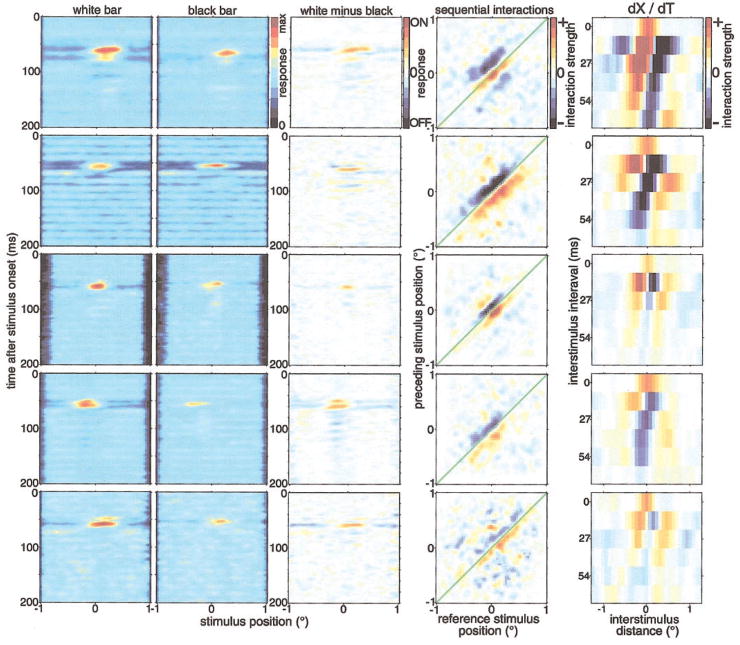
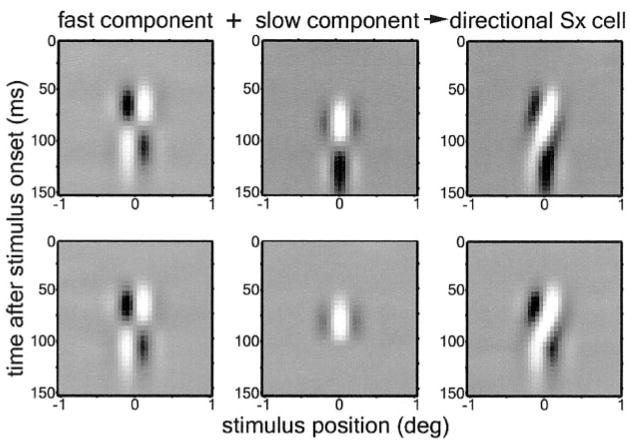
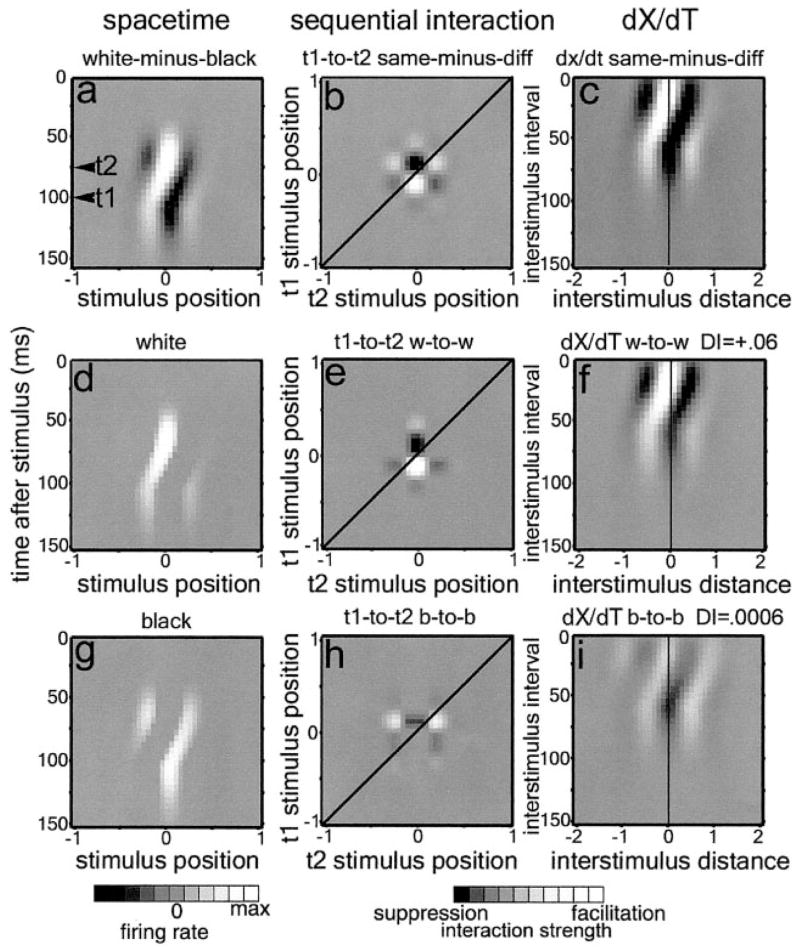
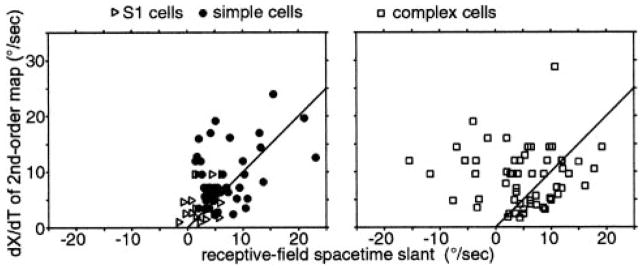
We used one-dimensional sparse noise stimuli to generate first-order spatiotemporal maps and second-order two-bar interaction maps for 65 simple and 124 complex direction-selective cells in alert macaque V1. Spatial and temporal phase differences between light and dark space-time maps clearly distinguished simple and complex cell populations. Complex cells usually showed similar direction preferences to light and dark bars, but many of the directional simple cells were much more direction selective to one sign of contrast than the reverse. We show that this is predicted by a simple energy model. Some of the direction-selective simple cells showed multiple space-time-slanted subregions, but others (previously described as S1 cells) had space-time maps that looked like just one subregion of an ordinary simple cell. Both simple and complex cells showed directional interactions (nonlinearities) to pairs of flashed bars (a 2-bar apparent-motion stimulus). The space-time slant of the simple cells correlated with the optimum dX/dT (velocity) of the paired-bar interactions. Some complex cells also showed a space-time slant; the direction of the slant usually correlated with the preferred direction of motion, but the degree of slant correlated with the inferred velocity tuning only when measured by a weighted-centroid calculation. Principal components analysis of the simple-cell space-time maps yielded one fast temporally biphasic component and a slower temporally monophasic component. We saw no consistent pattern for the spatial phase of the components, unlike previous reports; however, we show that principal components analysis may not distinguish between spatial offsets and phase offsets.


Figures

FIG. 1
FIG. 1
Background for the experiments described in this paper. A: diagrammatic space-time map of a linear direction-selective simple cell with space-time slant, plotted with the preferred direction of movement represented as rightward on the horizontal axis. 1 and 2 are 2 positions in the cell’s receptive field. The “preferred” side of the receptive field is the side from which preferred motion originates, according to the conventions of He and Masland (1997). B: if the perfectly linear cell in A was stimulated by bars presented at positions 1 and 2 in the preferred-direction sequence, the peak firing rate would be higher than if the same two stimuli were presented in the null-direction order, but the total spikes for the two directions would be the same (· · ·). A cell gives a directional response (total spikes in the preferred direction > total spikes in the null direction) if it combines responses nonlinearly (—). The “interaction” between the 2 stimuli is the difference between the · · · and —. C: stimulus configuration for the experiments in this paper. While the monkey fixated, pairs of bars, 1 white, 1 black, were presented each frame at 75 Hz along a stimulus range perpendicular to the cell’s preferred orientation. D: space-time maps. Firing rate is plotted as a function of stimulus position (corrected for eye position) and time after stimulus onset for each bar contrast. The space-time plots are always oriented so that the preferred direction of motion is rightward on the horizontal axis. The color code is a linear scale of firing rate. The dark-bar response is subtracted from the light-bar response to obtain a composite map. E: sequential-interaction maps. Spike activity is reverse correlated with pairs of sequentially presented stimuli. For every pair of stimuli, the second is considered the reference, and the first stimulus is considered the probe stimulus. Reference stimulus position (corrected for eye position) is plotted along the horizontal axis (rightward corresponds to the preferred direction) and probe stimulus position is plotted along the vertical axis (upward corresponds to the preferred direction). Points along the +45° diagonal correspond to occasions when the 2 sequential stimuli fell on the same retinal location (no motion); points to the right of the diagonal correspond to preferred-direction sequences and points to the left to null-direction sequences. The color code corresponds to nonlinear interaction strength. F: dX/dT maps. These maps show interaction strength as a function of interstimulus distance (horizontal axis) and interstimulus interval (vertical axis). The interstimulus interval represents the number of frames between the pairs of stimuli with which the activity is reverse correlated. Activity is always mapped at the peak of the reference stimulus response. To obtain these maps, −45° slices covering the interaction region (indicated by dotted rectangle in E) are averaged from sequential interaction maps generated using different inter-stimulus intervals. As with the interaction maps, the color scale indicates nonlinear interaction strength.
FIG. 2
FIG. 2
Representative complex cell and simple cell. A, B, G, and H: graph showss each cell’s response to a moving white or black bar. The complex cell was strongly directional to both white and black bars, but the simple cell was directional only to white bars. C, D, I, and J: space-time maps for white and black bar stimuli. For both cells, the preferred direction of stimulus motion is represented as rightward on the horizontal axis. The horizontal striations in the maps reflect the time course of the stimulus-driven elevation in activity in response to stimulus presentations other than the 1 whose onset was at time = 0. E, F, K, and L: spatial and temporal profiles calculated by averaging over ±10 ms and ±0.12°, respectively, centered on the peak response to white bars (because for both these cells the larger response was to white bars). Green and purple lines indicate the best-fitting phase of a wide Gabor for each profile. The 95% confidence intervals for the best-fitting phase for the simple-cell white spatial profile were ±15°; for the dark spatial profile, ±25°; for the white temporal profile, ±11°; for the dark temporal profile, ±12°. The 95% confidence intervals for best-fitting phase for the complex-cell white spatial profile were ±12°; for the dark spatial profile, ±22°; for the white temporal profile, ±23°; for the dark temporal profile, ±12°.
FIG. 3
FIG. 3
Various parameters measured for simple and complex directional cells. A: spatial and temporal phase differences for light and dark stimuli space-time maps for simple and complex cells (symbols indicate classification by qualitative assesment). B: histograms of temporal, spatial, and averaged spatial and temporal phase differences for the population of cells, showing that light/dark spatial and temporal phase differences distinguish simple from complex cells. C: direction indices to light and dark moving bars. D: ratio of light-bar or dark-bar direction index (DI; whichever is smaller) to DI for the other contrast.
FIG. 4
FIG. 4
Space-time maps, sequential interaction maps, and dX/dT maps for 5 conventional direction-selective simple cells. Each row represents one cell. All these cells had receptive-field eccentricities between 1.5 and 3°. For each spatial axis, the positive direction corresponds to the preferred direction of stimulus motion. First column: the space-time map to light bars; second column: the space-time map for dark bars; third column: the light-bar map minus the dark-bar map; fourth column: the 2-bar sequential interaction map for pairs of stimuli presented in sequential frames (13-ms intervals). Below/right of the green diagonal represents preferred-direction sequences and above/right represents null-direction sequences. Fifth column: the average interaction strength (calculated from a series of interaction maps) as a function of interstimulus interval.
FIG. 5
FIG. 5
Space-time maps, sequential interaction maps, and dX/dT maps for 5 direction-selective 1-subunit (S1) simple cells. All these cells had receptive-field eccentricities between 1.5 and 3°. Conventions as in Fig. 4.
FIG. 6
FIG. 6
Space-time maps, sequential interaction maps, and dX/dT maps for 5 direction-selective complex cells. All these cells had receptive-field eccentricities between 1.5 and 3°. Conventions as in Fig. 4. The white-minus-black maps, included at a reviewer’s request, do not distinguish light-excitatory/dark-inhibitory vs. dark-excitatory/light-inhibitory regions as they do for simple cells but rather simply indicate differences in magnitude between ON and OFF influences. For top 2 cells, the stimulus presentation rate was 37.5 Hz.
FIG. 7
FIG. 7
Space-time maps and sequential interaction maps for 5 direction-selective complex cells with relatively wide receptive fields. All these cells had receptive-field eccentricities between 1.5 and 3°. Conventions as in Fig. 4.
FIG. 8
FIG. 8
Models for generating a space-time slanted directional simple cell. Original energy model (top) and model with the slow component having a monophasic time course (bottom). In both models, the 2 spatial Gabor functions differ in their spatial phase, but they can be modeled as having the same phase and different center positions as in Fig. 10.
FIG. 9
FIG. 9
The 1st 2 principal components for the 5 directional simple cells in Fig. 4. Each row is 1 cell, in the same order as in Fig. 4; same color scheme. The weight of each component (the square of its Eigenvalue) is indicated in the top right corner.
FIG. 10
FIG. 10
Relationship between temporal and spatial properties of the 1st 2 principal components of the conventional simple cells. A: spatial phase vs. biphasic index for fast and slow principal components. B: relationship between biphasic index for the fast and slow principal components for each cell. C: relationship between spatial phase for the fast and slow principal components for each cell. D–H: principal components analysis of a model simple cell. D and E show the fast (D) and slow (E) nondirectional cells that were summed to give a space-time slanted directional simple cell (F). The cells in D and E differ in spatial position rather than in spatial phase, as in Fig. 8. G and H are the 1st 2 principal components of F. H does not accurately capture the spatial characteristics of E.
FIG. 11
FIG. 11
Exploration of the relationship of space-time slant to direction and velocity selectivity in a model simple cell. A: model simple cell; light minus dark responses of a directional simple cell generated by summing 2 nondirectional cells like the 2 in Fig. 8, bottom, except slightly phase shifted relative to Fig. 8. B: 2-bar interaction map, assuming a rectifying, squaring nonlinearity; same-contrast minus inverting-contrast responses. C: dX/dT map over all possible delays. D: rectified white-bar space-time map of this same cell. E: 2-bar interaction map for pairs of white bars. F: dX/dT map for pairs of white bars. G: rectified black-bar space-time map of this same cell. H: 2-bar interaction map for pairs of black bars. I: dX/dT map for pairs of black bars.
FIG. 12
FIG. 12
Correlation between space-time slant and optimum interstimulus distance for a 13-ms interstimulus interval (velocity and direction tuning) for all the cells in our population that showed paired-bar interactions. The space-time slant was calculated from the 1st-order map and the optimum dX/dT from the 2nd-order map; both calculated from the same spike train. Left: conventional simple cells and 1-subunit (S1) simple cells. The single-subunit simple cells generally showed less space-time slant. Right: most complex cells also showed a space-time slant that correlated in direction and magnitude with the optimum interstimulus distance for a 13-ms interstimulus interval. The line for x = y is shown for comparison.

Similar articles

Cited by

References

    1. Adelson EH, Bergen JR. Spatiotemporal energy models for the perception of motion. J Opt Soc Am A Opt Image Sci. 1985;2:284–299. - PubMed
    1. Albrecht DG, Geisler WS. Motion selectivity and the contrast-response function of simple cells in the visual cortex. Vis Neurosc. 1991;7:531–546. - PubMed
    1. Baker CL., Jr Linear filtering and nonlinear interactions in direction-selective visual cortex neurons: a noise correlation analysis. Vis Neurosci. 2001;18:465–485. - PubMed
    1. Baker CL, Cynader MS. Space-time separability of direction selectivity in cat striate cortex neurons. Vision Res. 1988;28:239–246. - PubMed
    1. Barlow HB, Levick WR. The mechanism of directionally selective units in rabbit’s retina. J Physiol. 1965;178:477–504. - PMC - PubMed

Publication types

LinkOut - more resources