. 2003 May;89(5):2743-59.
doi: 10.1152/jn.00822.2002.

Substructure of direction-selective receptive fields in macaque V1

Affiliations

Substructure of direction-selective receptive fields in macaque V1

Margaret S Livingstone et al. J Neurophysiol. 2003 May.

Abstract

We used two-dimensional (2-D) sparse noise to map simultaneous and sequential two-spot interactions in simple and complex direction-selective cells in macaque V1. Sequential-interaction maps for both simple and complex cells showed preferred-direction facilitation and null-direction suppression for same-contrast stimulus sequences and the reverse for inverting-contrast sequences, although the magnitudes of the interactions were weaker for the simple cells. Contrast-sign selectivity in complex cells indicates that direction-selective interactions in these cells must occur in antecedent simple cells or in simple-cell-like dendritic compartments. Our maps suggest that direction selectivity, and on and off segregation perpendicular to the orientation axis, can occur prior to receptive-field elongation along the orientation axis. 2-D interaction maps for some complex cells showed elongated alternating facilitatory and suppressive interactions as predicted if their inputs were orientation-selective simple cells. The negative interactions, however, were less elongated than the positive interactions, and there was an inflection at the origin in the positive interactions, so the interactions were chevron-shaped rather than band-like. Other complex cells showed only two round interaction regions, one negative and one positive. Several explanations for the map shapes are considered, including the possibility that directional interactions are generated directly from unoriented inputs.


Figures
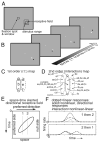
FIG. 1
FIG. 1
A and B: stimulus configuration used to generate 2-dimensional (2-D) interaction maps (not to scale). While the monkey fixated, small square stimuli were presented at 75 Hz at random positions within a stimulus range just larger than the cell’s activating region. In each frame, 2 stimuli were presented. For the experiments in Figs. 2–7, the 2 stimuli were always 1 black and 1 white. For the experiments in Fig. 8, the 2 stimuli were always both white or both black. Spikes were reverse correlated with the difference in position of pairs of stimuli, in either the same or previous frames. C: idealized 1st-order, space/space map for a simple cell; solid lines enclose an ON subregion and dotted lines enclose an OFF subregion. D: the predicted interaction patterns arising between and within each of the locations indicated in C. Solid lines outline same-contrast facilitatory interactions, and dotted lines outline same-contrast suppressive interactions. The stimulus-position pairs that map to each point in the interaction map are indicated as letter pairs, corresponding to probe (1st letter) and reference (2nd letter) stimulus pairs at the receptive-field locations indicated. E: idealized space-time map of a directional simple cell. F: facilitatory and suppressive interactions between 2 responses. Responses to each stimulus, presented at position 1 or 2 in E, alone are shown in gray. For each sequential stimulus pair, the linear sum of the 2 responses is shown by a dotted line. For this linear sum the response in the preferred direction will reach a higher peak firing rate than the response to the opposite direction, but the total spikes will be the same for the 2 directions. The solid lines show responses to the same 2 stimuli for an idealized cell that shows preferred-direction facilitation and null-direction suppression. The response in the preferred direction (1 then 2) is larger than the linear sum (facilitation), but the response in the other direction is smaller than the linear sum (suppression). The difference between the actual response and the linear sum is the interaction.
FIG. 2
FIG. 2
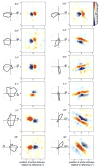
Interaction maps for pairs of sequentially presented spots, for 2 complex cells as a function of reverse correlation delay (top) and inter-spot interval (bottom). Direction tuning curves (left) were generated using fields of moving bars. The 1st cell was recorded at an eccentricity of 22° and the 2nd at 21°. The 2-D interaction maps are the same-minus-inverting responses; red on the color scale indicates positive interactions (same-contrast facilitation and inverting-contrast suppression), and blue indicates negative interactions (same-contrast suppression and inverting-contrast facilitation). The reverse correlation delay indicated in the top is for the reference stimulus; the interstimulus interval was 13 ms (1 frame). For the bottom, the reverse correlation delay was 50 ms for the 1st cell and 48 ms for the 2nd.
FIG. 3
FIG. 3
Direction tuning curves and 2-D sequential 2-spot interaction maps for 12 complex cells recorded in macaque V1. Direction tuning curves were generated using fields of moving bars; the number on the tuning curve indicates the maximum average firing rate per sweep in spikes/s; error bars (red) indicate SE. Receptive-field eccentricity of each unit is indicated above and to the right of each tuning curve. All the units were recorded during different recording sessions, except the 4th unit down in both columns, and these 2 units were recorded simultaneously from the same electrode as 2 clearly distinguishable spikes with almost opposite direction preferences. The 2-D interaction maps are plotted according to the same conventions as Fig. 2. The pairs of stimuli were from sequential frames (13-ms intervals).
FIG. 4
FIG. 4
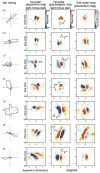
Direction tuning curves, 1-dimensional (1-D) space/time maps, 2-D receptive-field maps, and 2-D sequential 2-spot interaction maps for 7 simple cells recorded in macaque V1. Each row shows data for one cell. Left: direction tuning curves were generated using fields of moving bars; error bars (red) indicate SE. Receptive-field eccentricity of each unit is indicated above and to the left of each tuning curve. Left middle: 1-D space-time maps were calculated by reverse correlating activity with eye-position-corrected bar location along a 1-D stimulus range (Livingstone 1998); color scale reflects spike activity, light minus dark. The spatial dimension is the direction axis, perpendicular to the preferred orientation—this is the axis indicated as x in right middle. Right middle: 2-D receptive fields were calculated by reverse correlating activity with eye-position-corrected spot location (Livingstone 1998); color scale reflects spike activity, light minus dark. Orientation (y) and direction (x) axes are indicated. Right: sequential interaction maps were calculated using same-minus-inverting responses; scale reflects interaction strength. The pairs of stimuli were from sequential frames (13-ms intervals).
FIG. 5
FIG. 5
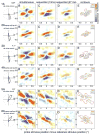
2-D sequential interaction maps using a small range of reference locations. Each row shows data from 1 cell. Left: the direction tuning to fields of bars. 2nd and 3rd columns: 1st-order (receptive-field) maps of responses to light and dark small spots at a reverse correlation delay corresponding to time to peak response. These were complex cells, so there is no obvious substructure to the receptive-field maps. The rectangles drawn on the receptive field indicate the regions selected for the reference stimulus location. Right 4 columns: paired-spot interaction maps for sequential stimuli (13-ms intervals); same-minus-inverting maps. Third column: maps for the entire stimulus range; 4th– 6th columns: the interaction maps generated from the same stimulus train using reference stimuli restricted to 1 of the 3 regions indicated on the 1st-order map.
FIG. 6
FIG. 6
Quantification of 2-D interaction maps. A: direction of the maximum gradient (from positive to negative interactions) of the 2-D sequential interaction map (same-minus-inverting) plotted against the actual preferred direction to moving bars. B: the magnitude of the nonlinearities for null and preferred sequences for simple (•) and complex cells (□). Nonlinearities for null-direction sequences are plotted on the vertical axis and nonlinearities for preferred-direction sequences on the horizontal axis. Interactions (the difference between sequential responses and responses to the same stimulus pairs at long interstimulus intervals) were measured for sequential same-contrast stimuli (for whichever contrast gave the larger interaction) as a percentage of the responses to the same two stimuli presented independently (250 ms apart). Complex cells on average showed larger nonlinearities than did simple cells. C: elongation ratio (width of direction kernel subunit/length) vs. direction tuning bandwidth to fields of bars. Cells with elongated interaction maps tended to have narrower direction tuning curves. D: elongation ratio vs. direction tuning bandwidth to fields of bars (•) or fields of dots (○). Cells with elongated interaction maps tended to have narrower tuning to bars but not to dots. E: histogram of the distribution of average interaction subunit elongation. Round interaction maps would have a low length/width ratio, and elongated maps would have a high ratio. F: histogram of the ratio of the lengths of positive and negative interaction regions for each cell. The distribution is significantly larger than a ratio of 1 (log = 0). G: histogram of the ratio of the amplitudes of positive and negative interaction regions for each cell. This distribution is not significantly different from a ratio of 1. H: the ratio of the positive interaction region length to the negative interaction length vs. their relative amplitudes. This shows that the fact that most positive interaction regions were longer than the negative interaction regions (F) cannot be explained by an amplitude difference.
FIG. 7
FIG. 7
Sequential interaction maps for all contrast combinations for 1 complex cell calculated using the long-interval-subtraction method (see METHODS); all maps were calculated from the same spike train. Color scale reflects facilitatory and suppressive interactions. This is the same cell as in Fig. 3, right, 3rd from the top. Note the reversal of the interaction pattern for inverting-contrast stimulus pairs.
FIG. 8
FIG. 8
Simultaneous and sequential interaction maps for 3 complex cells calculated using the long-interval-subtraction method. Each pair of rows is from a single cell (1 and 2, 3 and 4, 5 and 6). For comparison with the same-minus-inverting interaction maps, these 3 cells are, in order, the same cells as the 3rd, 4th, and 5th cells from the top on the right side of Fig. 3. A: direction tuning for white or black bars. B–D: 2-D 2-stimulus interaction maps for pairs of white stimuli (odd rows) or pairs of dark stimuli (even rows) at interstimulus intervals as indicated at the top of each column. All maps in each row were calculated from the same spike train. E: contour plots of the maps in B–D showing the shift in interactions with different interstimulus intervals; —, facilitatory interactions; . . ., suppressive interactions.
FIG. 9
FIG. 9
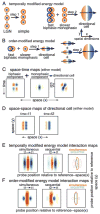
Space/space/time model for the generation of a directional simple cell and its predicted interaction maps. See METHODS for model details. A and B: diagram of 2 possible sequences for generating a cell with both orientation and direction selectivity: orientation selectivity is generated before direction selectivity (conventional energy model, A) or direction selectivity is generated before orientation selectivity (B). In A–D, red indicates light excitation/dark suppression and blue indicates dark excitation/light suppression. In E and F red indicates facilitatory interactions and blue indicates suppressive interactions. See text for details.

Similar articles

Cited by

References

    1. Adelson EH, Bergen JR. Spatiotemporal energy models for the perception of motion. J Opt Soc Am A Opt and Image Sci. 1985;2:284–299. - PubMed
    1. Albright TD, Desimone R, Gross CG. Columnar organization of directionally selective cells in visual area MT of the macaque. J Neurophysiol. 1984;51:16–31. - PubMed
    1. Alonso JM, Usrey WM, Reid RC. Rules of connectivity between geniculate cells and simple cells in cat primary visual cortex. J Neurosci. 2001;21:4002–4015. - PMC - PubMed
    1. Anstis SM, Rogers BJ. Illusory reversal of visual depth and movement during changes of contrast. Vis Res. 1975;15:957–961. - PubMed
    1. Anzai A, Ohzawa I, Freeman RD. Neural mechanisms for processing binocular information. II. Complex cells. J Neurophysiol. 1999;82:909–924. - PubMed

Publication types

LinkOut - more resources