. 2003 Jun 15;549(Pt 3):697-717.
doi: 10.1113/jphysiol.2002.037481. Epub 2003 May 9.

Biophysical and pharmacological characterization of voltage-gated calcium currents in turtle auditory hair cells

Affiliations

Biophysical and pharmacological characterization of voltage-gated calcium currents in turtle auditory hair cells

M E Schnee et al. J Physiol. .

Abstract

Hair cell calcium channels regulate membrane excitability and control synaptic transmission. The present investigations focused on determining whether calcium channels vary between hair cells of different characteristic frequencies or if multiple channel types exist within a hair cell, each serving a different function. To this end, turtle auditory hair cells from high- (317 +/- 27 Hz) and low-frequency (115 +/- 6 Hz) positions were voltage clamped using the whole-cell recording technique, and calcium currents were characterized based on activation, inactivation and pharmacological properties. Pharmacological sensitivity to dihydropyridines (nimodipine, Bay K 8644), benzothiazepines (diltiazem) and acetonitrile derivatives (verapamil, D600) and the insensitivity to non-L-type calcium channel antagonists support the conclusion that only L-type calcium channels were present. Fast activation rise times (< 0.5 ms), hyperpolarized half-activation potentials and a relative insensitivity to nimodipine suggest the channels were of the alpha1D (CaV1.3) variety. Although no pharmacological differences were found between calcium currents obtained from high- and low-frequency cells, low-frequency cells activated slightly faster and at hyperpolarized potentials, with half-activating voltages of -43 +/- 1 mV compared to -35 +/- 1 mV. Inactivation was observed in both high- and low-frequency cells. The time course of inactivation required three time constants for a fit. Long depolarizations could result in complete inactivation. The voltage of half-inactivation was -40 +/- 2 mV for high-frequency cells and -46 +/- 2 mV for low-frequency cells. Calcium channel inactivation did not significantly alter hair cell electrical resonant properties elicited from protocols where the membrane potential was hyperpolarized or depolarized prior to characterizing the resonance. A bell-shaped voltage dependence and modest sensitivities to intracellular calcium chelators and external barium ions suggest that inactivation was calcium dependent.


Figures
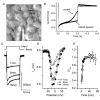
Figure 1
Figure 1. Recording procedures and calcium current run-up
A, differential interference contrast image of the recording electrode and papilla after clearing that ensured rapid and reproducible solution exchange to cells. B, to estimate drug delivery time, a hair cell was voltage clamped at −84 mV and depolarized to −14 mV for durations that allowed for calcium accumulation to activate the caesium-permeant SK calcium-activated potassium conductance (Tucker & Fettiplace, 1996). Bath application of apamin at 100 nm completely blocked the SK current in about 4 min. C, upon establishment of the whole-cell configuration, calcium currents increased in amplitude, often doubling or tripling in size. D, there was no shift in the plot of peak current against command potential (IV) for different times after rupture of the patch. C and D are from the same cell. E, a plot of the normalized current against time after rupture was best fitted by a single exponential function with a time constant of 4.3 ± 0.3 min (n = 10). After reaching a maximal current, recordings were stable for more than 1 h, showing a less than 10 % reduction in peak current during this time.
Figure 2
Figure 2. Tonotopic variations in hair cell properties
A, examples of electrical resonance obtained from hair cells at the high (left) and low (right) frequency position in response to 100 pA current step injections using a potassium-based intracellular solution. B, examples of calcium currents obtained from a high- (left) and low-frequency (right) cell with the corresponding stimulus protocol shown above, using caesium-based electrodes. Larger currents were obtained from high-frequency cells. C, a plot of current rise time (10–90 %) against command potential for low- (▵, n = 11) and high-frequency (□, n = 12) cells. Single exponential fits of the form: Y = Y0+Aexp(−x/τ) were obtained. Values of 260 ± 10, 20 ± 5 and 102 ± 7 μs were obtained for Y0, A and τ, respectively (r2= 0.94) for high-frequency cells and 260 ± 1, 53 ± 10 and 153 ± 14 μs (r2= 0.99) for low-frequency cells. * Points that are significantly different. D, IV curves for 10 high-frequency (□) and 10 low-frequency cells (▵). E, normalized plots from the data shown in D, symbols the same, with Boltzmann fits to the data. Half-activation voltages (V1/2) were −35 ± 1 and −43 ± 1 mV and slopes were 4.7 ± 0.3 and 4.2 ± 0.2 mV−1 for high- and low-frequency cells, respectively (r2= 0.99 for each).
Figure 3
Figure 3. Nimodipine blocks the calcium current in a voltage-dependent manner
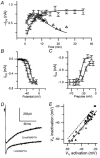
A, calcium currents elicited by depolarizing the cell to −14 mV from holding potentials of −84 mV or −64 mV in the presence and absence of 5 μm nimodipine for a high-frequency cell. No difference in the control response is seen, but nimodipine block was greater at a −64 mV holding potential. B, IV curves generated from cells using holding potentials of −84 or −64 mV in the absence (−84 mV, □; −64 mV, ○) and presence (−84 mV, ▪; −64 mV, •) of 5 μm nimodipine. C and D, normalized IV curves for data obtained in the absence (□) and presence (▵) of 5 μm nimodipine and the difference (nimodipine-sensitive, •), from a holding potential of −84 mV (C) and −64 mV (D). There was a slight shift in the V1/2 from −40 ± 0.3 to −37 ± 0.3 mV for the difference plot at −84 mV, but no differences in slope (5.2 ± 0.3 mV−1). No difference in IV plots was observed for the holding potential of −64 mV, where the V1/2 was −39 ± 1 mV and the slope 4.2 ± 0.8 mV−1. E, dose-response curves with their corresponding fits to the Hill equation for holding potentials of −84 mV (□) and −64 mV (▵). The number of cells tested is given in parenthesis as (−84 mV, −64 mV, respectively). Values for Bmax, the half-blocking dose and the Hill coefficient were 69 ± 4 %, 2.2 ± 0.2 μm and 2.1 ± 0.4, respectively, for a holding potential of −84 mV and 90 ± 4 %, 1.8 ± 0.2 μm and 1.7 ± 0.2, respectively, for the holding potential of −64 mV (r2 values of 0.989 and 0.99, respectively, were obtained for the two conditions). F, plots normalized to the maximal blocking dose for holding potentials of −84 mV (□) and −64 mV (▵) with the corresponding fit to the Hill equation. Here, values of 1.0, 2.0 ± 0.1 μm and 1.9 ± 0.2 were obtained for Bmax, half-blocking dose and the Hill coefficient, respectively (r2= 0.99). G, the voltage dependence of nimodipine block was investigated further by plotting the ratio of current obtained in the presence of 5 μm nimodipine to control current at different test potentials against the test potential. A single exponential (Y = Y0+Aexp(−xx)) best fitted this plot with values of 0.3 ± 0.01, 0.003 ± 0.001 and 8.8 ± 1 mV for Y0, A and δx, respectively (r2= 0.98). HJ, use dependence of nimodipine block was investigated by depolarizing a cell to −14 mV for 20 ms at a frequency of 1 Hz. Examples of the first and last response from a holding potential of −84 mV (H) or −64 mV (J) are given with the thicker lines representing the first and the thin lines the last. Time zero represents the start of the 1 Hz stimulus protocol that begins 10 min after drug application. Traces at the top are in the absence and the bottom in the presence of 5 μm nimodipine (Nim.). I, plot of the peak current against time where the symbols correspond to their respective condition (H, J). The continuous lines reflect the initial value. From a holding potential of −84 mV a further decrease of 9 % was observed while from a holding potential of −64 mV a further reduction of 32 % was observed for this cell.
Figure 4
Figure 4. Bay K 8644, a dihydropyridine agonist, increases hair cell calcium currents
A, an example of a calcium current obtained in the absence (upper) and presence (lower) of the dihydropyridine agonist Bay K 8644. The stimulus protocol is shown at the top; more negative steps refer to IV plots in the presence of Bay K 8644. B, IV curves demonstrating that the current magnitude increased and voltage sensitivity shifted in a hyperpolarized direction. In each panel, □s are the control and ▵s are in the presence of 1 μm Bay K 8644. C, IV plots normalized to maximum current, demonstrating the shift in the V1/2. Continuous lines represent fits to a Boltzmann function, where the V1/2 values were −37 ± 0.3 and −51 ± 2 mV and the slopes were 4.9 ± 0.2 and 3.5 ± 0.2 mV−1 for control and Bay K 8644-treated cells, respectively (r2= 0.99 for both fits, n = 4). D, activation kinetics were slowed as demonstrated by plotting the 10–90 % rise time of the current activation in the absence and presence of 1 μm Bay K 8644. Coninuous lines represent exponential fits with voltage dependence, δx, of 153 ± 26 and 93 ± 8 mV for control and Bay K 8644-treated cells, respectively (r2 values were 0.99 and 0.96 for control and Bay K 8644-treated (n = 4) cells, respectively).
Figure 5
Figure 5. Traditional L-type channel blockers can completely antagonize the calcium current
Dose–response curves, with corresponding fits to Hill equations, are shown for verapamil (A), D600 (B) and diltiazem (C). Insets are currents elicited from depolarizations to −14 mV from a holding potential of −84 mV in the absence and presence of the three highest drug concentrations (averages of four). The control trace is the largest current in A and B, but in the diltiazem trace it appears that the low dose potentiates the response. The scale bar is 500 pA and 20 ms. The value of n for each dose is given in parenthesis. Half-blocking doses obtained from fitting Hill equations were 192 ± 20, 375 ± 25 and 367 ± 22 μm for verapamil, D600 and diltiazem, respectively. Hill coefficients were 1.7 ± 0.4, 1.6 ± 0.2 and 2.5 ± 0.3 for verapamil, D600 and diltiazem, respectively, with r2 values of 0.997, 0.998 and 0.99, respectively.
Figure 6
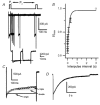
Figure 6. The interpulse interval is a critical determinant of inactivation
A, a protocol that held the cell at −84 mV and delivered a 20 ms depolarization to −14 mV at time 0 and at varying times (P2) following the initial pulse, was used to determine the required interpulse interval needed to preserve inactivation. The upper panel shows the stimulus protocol, the middle traces are currents elicited and the lower trace is an expansion of the first two current responses used to illustrate the loss of a time-dependent component of inactivation (no averaging was used in these protocols). The continuous line is shown to point out the loss of both peak current and time-dependent inactivation. B, a plot of the peak current normalized to the control at time 0 against interpulse duration (P2) illustrates the time to recovery from inactivation and has an exponential relationship with a time constant of 174 ± 36 ms (n = 21). C, the response to a 1 s depolarization to −14 mV with corresponding single (black), double (light grey) and triple (white, dashed) exponential fit. D, that all channels can inactivate is illustrated by depolarizing a cell to −14 mV for 25 s. Both C and D are single-episode responses.
Figure 8
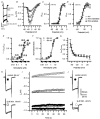
Figure 8. The physiological significance of calcium channel inactivation was investigated in both voltage- and current-clamp experiments
A, hair cell currents measured in response to depolarizing voltage steps between −64 and 0 mV from a holding potential of −84 mV (top) or −44 mV (bottom). B, IV plot of data in A showing reduction in the magnitude of the calcium current when the holding potential (Vh) was varied from −84 to −44 mV. •s represent the return to the control condition of −84 mV. C, current-clamp responses (averages of 20) from a hair cell where current (−25 pA) was first injected to hyperpolarize the cell to −84 mV and then injected (50 pA, depolarizing total of 75 pA) to depolarize the cell to its best resonant voltage (left) compared to the same cell where current was injected (50 pA) to elicit electrical resonance (right). The frequencies of the oscillations were 290 and 312 Hz for left and right responses, respectively. The quality (Q) of the resonance measured from the time course of the decay in the oscillations (Art & Fettiplace, 1987) according to the equation Q = [(πf0τ0)2+ 1/4]1/2, where f0 is the resonant frequency and τ0 is the time constant measured from the exponential decay of the oscillations at current onset, was 5.5 and 5.2, respectively.
Figure 7
Figure 7. Calcium channel inactivation has a bell-shaped voltage dependence and is similar between hair cells of different papillary locations
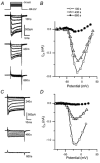
A, examples of a hair cell's current response to a stimulus protocol using either a 200 or a 20 ms prepulse to potentials between −114 and 96 mV, incremented by 10 mV, followed by a test pulse to −14 mV for 20 ms and then a return to the holding potential of −84 mV. The stimulus protocol shown above the current records illustrates the shape of the protocol used. The traces shown are for prepulses to −84 mV, −14 mV and +86 mV (bottom to top). Inactivation is measured as the decrease in current amplitude during the test pulse. B, a plot of peak current during the step to −14 mV against the corresponding prepulse potential to demonstrate that the magnitude of current decrease was greater for longer pulse durations, but that the voltage dependence of the process was unaffected. The response to the 20 ms pulses typically showed a rebound effect where the current maximum was greater after depolarizing prepulses than control. C, a plot of percentage current inactivated against prepulse duration has an exponential relationship with a time constant of 35 ± 8 ms (n is given by points in the plot). A similar plot of the V1/2 for inactivation, measured from the Boltzmann fits to the data shown in B (data between −114 and −4 mV fit) showed no difference between prepulse values. D, currents in response to a protocol that varied the prepulse from −114 to 104 mV for 20 ms, followed by a 20 ms pulse to −10 mV from a holding potential of −84 mV are shown for a high- (top) and a low-frequency (bottom) cell. Traces shown are for prepulses to −84 mV, −14 mV and +76 mV. E, normalized plots of test current against prepulse potential were bell-shaped for both frequency positions. F, the V1/2 of inactivation measured from the Boltzmann fits to the data was −40 ± 2 and −46 ± 2 mV, and the slope value was 4 ± 2 mV−1 for both high- and low-frequency cells (r2 for fits were 0.99 and 0.97 for high- and low-frequency cells, respectively). G, a plot of the V1/2 for inactivation against the V1/2 for activation gives a linear relationship with a slope of 1.0 ± 0.1 and a y-intercept of −9 ± 3 mV (r2= 0.88).
Figure 9
Figure 9. Inactivation persists with barium as the charge carrier
A, examples of currents elicited in response to a 1 s depolarization from −84 to −14 mV in the presence of 2.8 and 5 mm calcium or 5 mm barium (single traces). B, expanded view of the initial portion of currents elicited from A to better illustrate the effects on inactivation. C, fast and intermediate time constants of inactivation from fits to data shown in A. D, IV plots for activation using 5 mm calcium (□) and 5 mm barium (▵) demonstrating the increase in maximal current and a leftward shift in the plot. Symbols are the same for each panel. E, IV plots generated from the data shown in D normalized to peak current for each ionic condition and fitted with single Boltzmann functions. The V1/2 for records obtained in 5 mm calcium and 5 mm barium was −42 ± 1 and −53 ± 1 mV, respectively. The slopes for records obtained in 5 mm calcium and 5 mm barium were 3.4 ± 0.5 and 2.6 ± 0.2 mV−1, respectively. All fits had r2 values greater than 0.98. F, current-prepulse voltage plot demonstrating the effects of divalent ion species on inactivation. G, inactivation persists in the presence of barium. For clarity, the Boltzmann fits to the inactivation currents normalized to peak current (data from F) are shown without corresponding data points. The voltages of half-inactivation for 5 mm calcium and 5 mm barium were −47 ± 1 and −62 ± 1 mV, respectively. The slopes for 5 mm calcium and 5 mm barium were 4 ± 1 and 7 ± 1 mV−1, respectively. All fits had r2 values greater than 0.98.
Figure 10
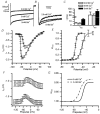
Figure 10. Calcium buffers alter, but do not prevent inactivation of the calcium currents
A, the time course of run-up of the calcium current is decreased in 30 mm BAPTA (n = 6) as compared to 1 mm BAPTA (n = 12). The time constant of the exponential fit to the data shown in A decreased from 7 ± 2 to 2.7 ± 0.7 min as the concentration of BAPTA increased from 1 mm (□) to 30 mm (▵). In addition, the initial amplitude of the measured peak current was also increased with higher concentrations of BAPTA. Responses in 30 mm reached a peak current and then ran down over time by almost 500 pA. The sum of two exponentials was used to fit this data, with the rising phase having a time constant of 2.7 ± 0.7 min and the falling phase a time constant of 12.8 ± 0.5 min. Activation (B) and inactivation (C) IV plots generated from the protocols described in Fig. 2 and 7D, respectively, show a trend towards depolarized voltages for activation and the persistence of inactivation even at 30 mm BAPTA (n = 12 for 1 mm BAPTA (□) and n = 6 for 30 mm BAPTA (▵)). Boltzmann fits to the normalized IV curves gave V1/2 values of −39 ± 1 and −25 ± 2 mV for 1 and 30 mm BAPTA, respectively, and slopes of 4.1 ± 0.1 and 4.7 ± 0.3 mV−1, respectively. Boltzmann functions to the inactivation curves similarly shifted in a depolarized direction, with half-inactivation voltages of −43 ± 2 and −26 ± 3 mV, respectively. Inactivation protocols were as described earlier using 20 ms prepulses. The magnitude of inactivation was reduced from 23 ± 1 to 16 ± 1 % (1 mmvs. 30 mm BAPTA). D and E, current responses to 1 s depolarizations to −10 mV using an intracellular BAPTA concentration of 1 or 30 mm. Replotting the V1/2 of activation against the V1/2 of inactivation for 1 mm BAPTA (□, low frequency, ▵, high frequency), 10 mm BAPTA (♦), 30 mm BAPTA (▪) and 5 mm external barium (▴) has a linear relationship. The dashed line represents an intercept of 0 and a slope of 1. The continuous line is a linear regression having a slope of 1 ± 0.05 and an intercept of 7.5 ± 0.5 mV (r2= 0.83).
Figure 11
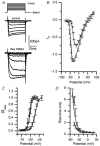
Figure 11. Calcium currents run down to near 0 pA when intracellular calcium is elevated by using a low-affinity calcium buffer (1 mm difluoroBAPTA, n = 3)
A, examples of the time course of run-down, with the stimulus protocol given at the top and current responses over time shown below. B, IV plots show the decrease in current amplitude during the recording. No shift in activation was observed. C, electrodes, filled with an internal solution where magnesium was not included, also demonstrated strong run-down behaviour. ATP-dependent processes will fail without the presence of magnesium. D, examples of currents elicited at different times after establishing the whole-cell configuration with corresponding IV plots. Again, no shift in activation curve was observed (n = 3).

Similar articles

Cited by

References

    1. Armstrong CE, Roberts WM. Electrical properties of frog saccular hair cells: distortion by enzymatic dissociation. J Neurosci. 1998;18:2962–2973. - PMC - PubMed
    1. Art JJ, Crawford AC, Fettiplace R. Electrical resonance and membrane currents in turtle cochlear hair cells. Hear Res. 1986;22:31–36. - PubMed
    1. Art JJ, Fettiplace R. Variation of membrane properties in hair cells isolated from the turtle cochlea. J Physiol. 1987;385:207–242. - PMC - PubMed
    1. Art JJ, Fettiplace R, Wu YC. The effects of low calcium on the voltage-dependent conductances involved in tuning of turtle hair cells. J Physiol. 1993;470:109–126. - PMC - PubMed
    1. Art JJ, Wu YC, Fettiplace R. The calcium-activated potassium channels of turtle hair cells. J Gen Physiol. 1995;105:49–72. - PMC - PubMed

Publication types

MeSH terms

Substances

LinkOut - more resources