

Mitochondrial succinic-semialdehyde dehydrogenase of the gamma-aminobutyrate shunt is required to restrict levels of reactive oxygen intermediates in plants
- PMID: 12740438
- PMCID: PMC164534
- DOI: 10.1073/pnas.1037532100
Mitochondrial succinic-semialdehyde dehydrogenase of the gamma-aminobutyrate shunt is required to restrict levels of reactive oxygen intermediates in plants
Abstract
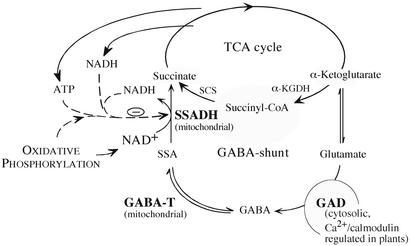
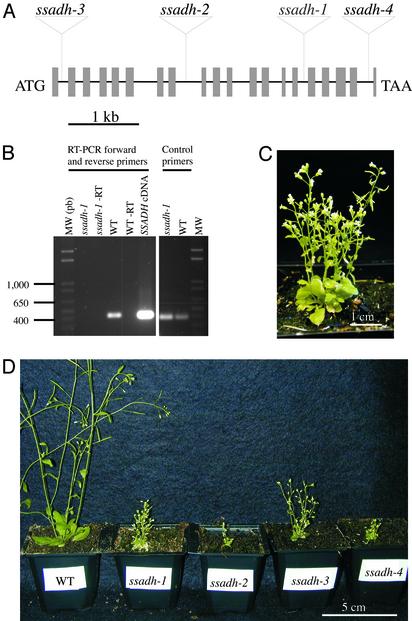
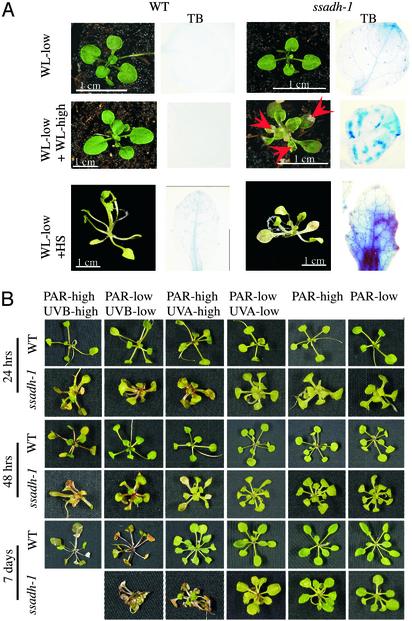
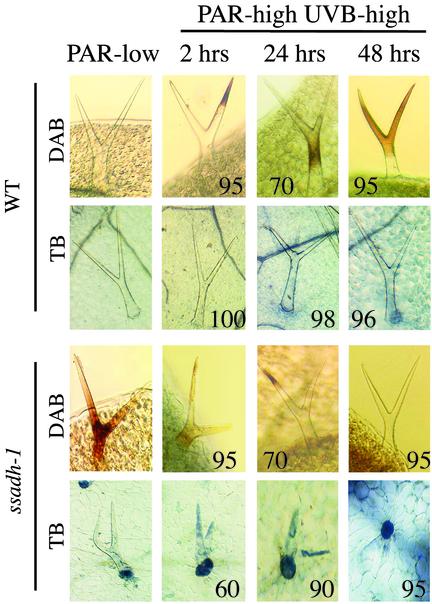
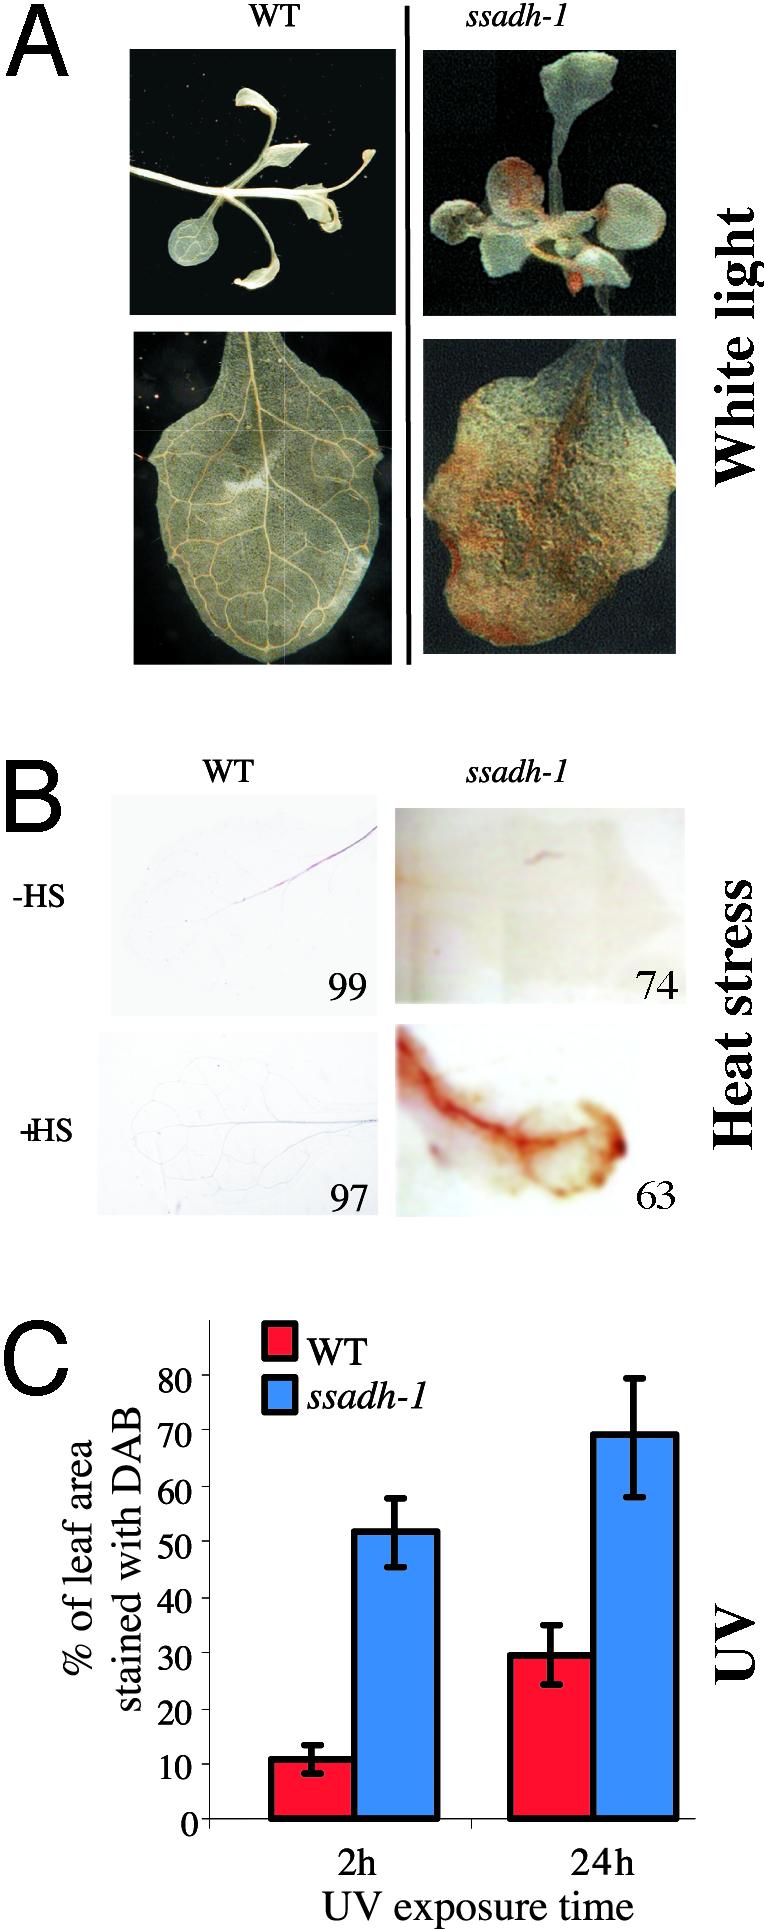
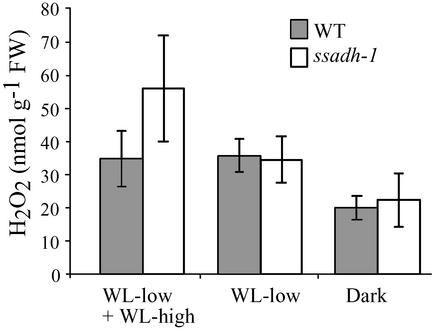
The gamma-aminobutyrate (GABA) shunt is a metabolic pathway that bypasses two steps of the tricarboxylic acid cycle, and it is present in both prokaryotes and eukaryotes. In plants the pathway is composed of the calcium/calmodulin-regulated cytosolic enzyme glutamate decarboxylase and the mitochondrial enzymes GABA transaminase and succinic-semialdehyde dehydrogenase (SSADH). The activity of the GABA shunt in plants is rapidly enhanced in response to various biotic and abiotic stresses. However the physiological role of this pathway remains obscure. To elucidate its role in plants, we analyzed Arabidopsis T-DNA knockout mutants of SSADH, the ultimate enzyme of the pathway. Four alleles of the ssadh mutation were isolated, and these exhibited a similar phenotype. When exposed to white light (100 micromol of photons per m2 per s), they appear dwarfed with necrotic lesions. Detailed spectrum analysis revealed that UV-B has the most adverse effect on the mutant phenotype, whereas photosynthetic active range light has a very little effect. The ssadh mutants are also sensitive to heat, as they develop necrosis when submitted to such stress. Moreover, both UV and heat cause a rapid increase in the levels of hydrogen peroxide in the ssadh mutants, which is associated with enhanced cell death. Surprisingly, our study also shows that trichomes are hypersensitive to stresses in ssadh mutants. Our work establishes a role for the GABA shunt in preventing the accumulation of reactive oxygen intermediates and cell death, which appears to be essential for plant defense against environmental stress.
Figures
Similar articles
-
Mutants of GABA transaminase (POP2) suppress the severe phenotype of succinic semialdehyde dehydrogenase (ssadh) mutants in Arabidopsis.PLoS One. 2008;3(10):e3383. doi: 10.1371/journal.pone.0003383. Epub 2008 Oct 10. PLoS One. 2008. PMID: 18846220 Free PMC article.
-
GABA shunt deficiencies and accumulation of reactive oxygen intermediates: insight from Arabidopsis mutants.FEBS Lett. 2005 Jan 17;579(2):415-20. doi: 10.1016/j.febslet.2004.12.004. FEBS Lett. 2005. PMID: 15642352
-
A novel gamma-hydroxybutyrate dehydrogenase: identification and expression of an Arabidopsis cDNA and potential role under oxygen deficiency.J Biol Chem. 2003 Oct 17;278(42):41552-6. doi: 10.1074/jbc.M305717200. Epub 2003 Jul 25. J Biol Chem. 2003. PMID: 12882961
-
Vigabatrin and newer interventions in succinic semialdehyde dehydrogenase deficiency.Ann Neurol. 2003;54 Suppl 6:S66-72. doi: 10.1002/ana.10626. Ann Neurol. 2003. PMID: 12891656 Review.
-
Inherited disorders of GABA metabolism.J Inherit Metab Dis. 1993;16(4):704-15. doi: 10.1007/BF00711902. J Inherit Metab Dis. 1993. PMID: 8412016 Review.
Cited by
-
Mitochondrial biogenesis and function in Arabidopsis.Arabidopsis Book. 2008;6:e0111. doi: 10.1199/tab.0111. Epub 2008 Jul 9. Arabidopsis Book. 2008. PMID: 22303236 Free PMC article.
-
Ectopic expression of VpALDH2B4, a novel aldehyde dehydrogenase gene from Chinese wild grapevine (Vitis pseudoreticulata), enhances resistance to mildew pathogens and salt stress in Arabidopsis.Planta. 2012 Aug;236(2):525-39. doi: 10.1007/s00425-012-1624-z. Epub 2012 Mar 23. Planta. 2012. PMID: 22437646
-
Kinetic and structural insights into enzymatic mechanism of succinic semialdehyde dehydrogenase from Cyanothece sp. ATCC51142.PLoS One. 2020 Sep 23;15(9):e0239372. doi: 10.1371/journal.pone.0239372. eCollection 2020. PLoS One. 2020. PMID: 32966327 Free PMC article.
-
Role of plant glyoxylate reductases during stress: a hypothesis.Biochem J. 2009 Sep 14;423(1):15-22. doi: 10.1042/BJ20090826. Biochem J. 2009. PMID: 19740079 Free PMC article. Review.
-
"Help is in the air": volatiles from salt-stressed plants increase the reproductive success of receivers under salinity.Planta. 2020 Jan 13;251(2):48. doi: 10.1007/s00425-020-03344-y. Planta. 2020. PMID: 31932951
References
-
- Varju, P., Katarova, Z., Madarasz, E. & Szabo, G. (2001) Cell Tissue Res. 305, 239-246. - PubMed
-
- Medina-Kauwe, L. K., Tobin, A. J., De Meirleir, L., Jaeken, J., Jakobs, C., Nyhan, W. L. & Gibson, K. M. (1999) J. Inherit. Metab. Dis. 22, 414-427. - PubMed
-
- Jakobs, C., Jaeken, J. & Gibson, K. M. (1993) J. Inherit. Metab. Dis. 16, 704-715. - PubMed
-
- Tillakaratne, N. J., Medina-Kauwe, L. & Gibson, K. M. (1995) Comp. Biochem. Physiol. A 112, 247-263. - PubMed
-
- Shelp, B. J., Bown, A. W. & McLean, M. D. (1999) Trends Plant Sci. 4, 446-452. - PubMed
Publication types
MeSH terms
Substances
LinkOut - more resources
Full Text Sources
Other Literature Sources
Molecular Biology Databases
