. 2003 May 15;22(10):2472-83.
doi: 10.1093/emboj/cdg233.

Genome-wide analysis of nuclear mRNA export pathways in Drosophila

Affiliations

Genome-wide analysis of nuclear mRNA export pathways in Drosophila

Andrea Herold et al. EMBO J. .

Abstract

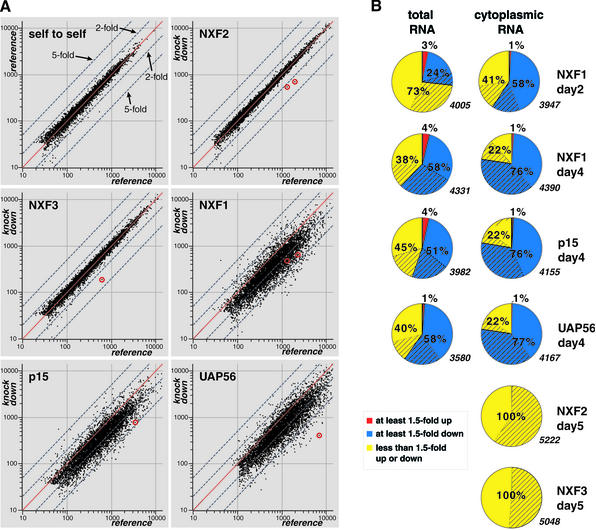
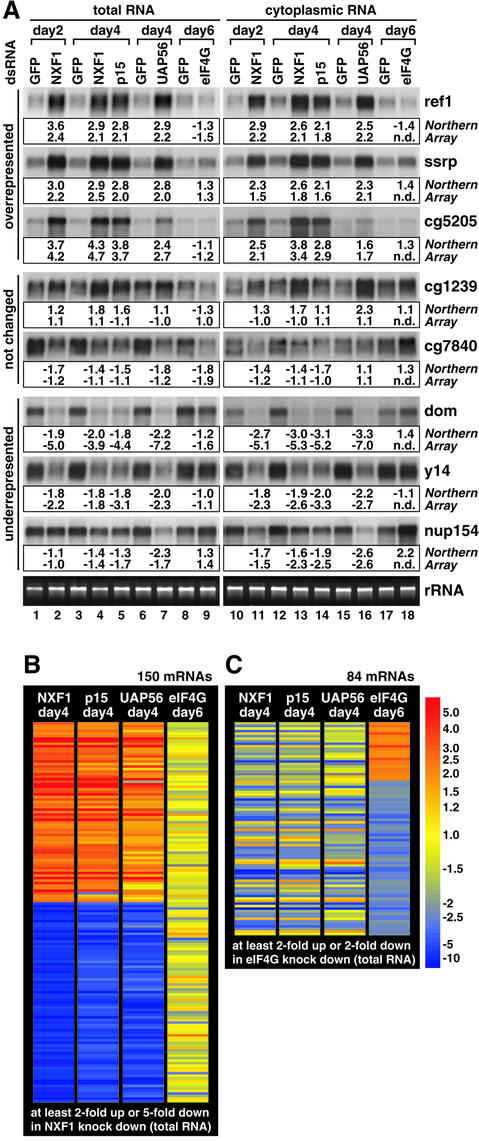
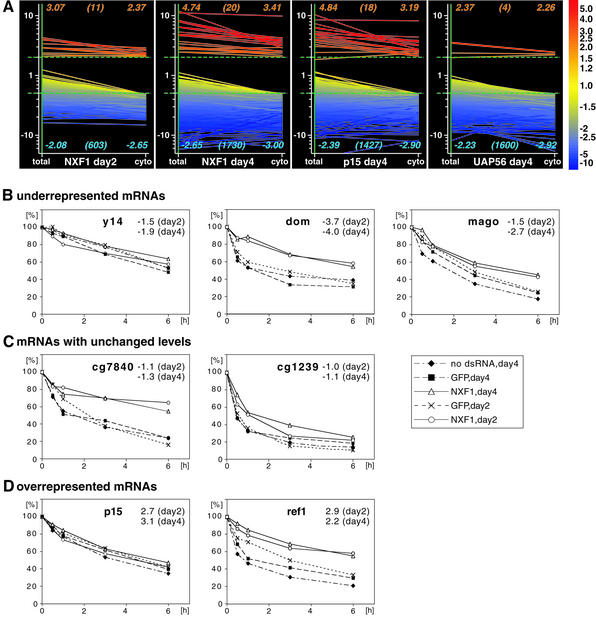
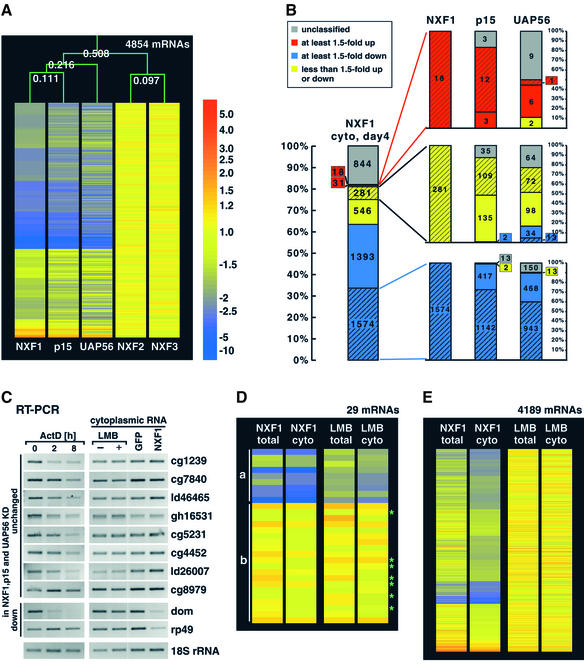
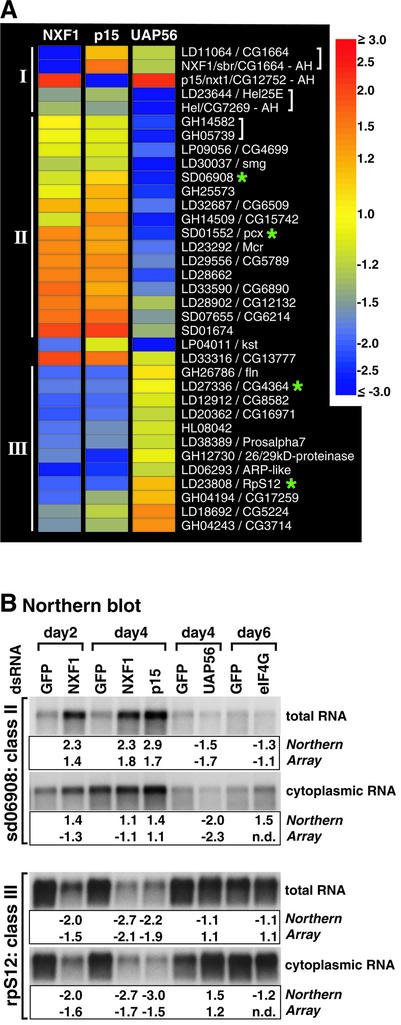
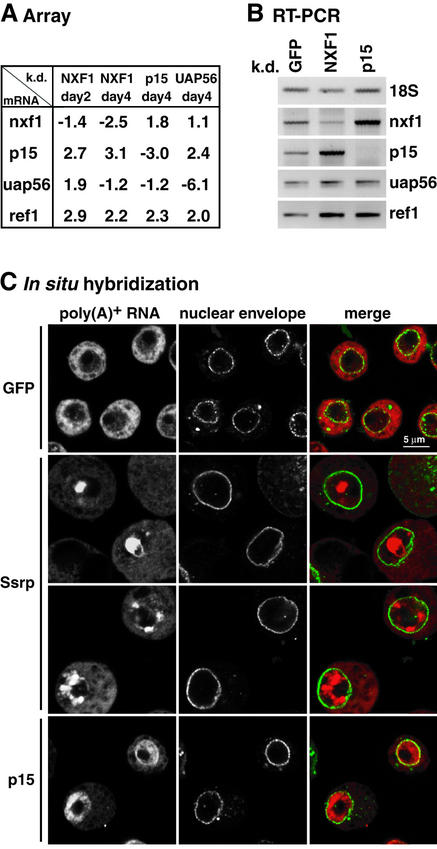
NXF1, p15 and UAP56 are essential nuclear mRNA export factors. The fraction of mRNAs exported by these proteins or via alternative pathways is unknown. We have analyzed the relative abundance of nearly half of the Drosophila transcriptome in the cytoplasm of cells treated with the CRM1 inhibitor leptomycin-B (LMB) or depleted of export factors by RNA interference. While the vast majority of mRNAs were unaffected by LMB, the levels of most mRNAs were significantly reduced in cells depleted of NXF1, p15 or UAP56. The striking similarities of the mRNA expression profiles in NXF1, p15 and UAP56 knockdowns show that these proteins act in the same pathway. The broad effect on mRNA levels observed in these cells indicates that the functioning of this pathway is required for export of most mRNAs. Nonetheless, a set of mRNAs whose export was unaffected by the depletions and some requiring NXF1:p15 but not UAP56 were identified. In addition, our analysis revealed a feedback loop by which a block to mRNA export triggers the upregulation of genes involved in this process.


Figures

None
Fig. 1. Depletion of NXF1, p15 or UAP56 results in global changes of mRNA levels. (A) Scatter plot representation of individual measurements using cytoplasmic RNA samples isolated from different knockdowns. The normalized intensity values of the experimental samples are plotted against the normalized intensity values of the reference samples. In addition to the regression line (red line: same intensity in both samples), the 2- and 5-fold lines (dashed lines) are shown. Spots representing mRNAs targeted by RNAi are marked with a red circle. NXF1 and NXF2 were each represented by two spots. (B) All detectable mRNAs were classified according to their relative expression levels. Only mRNAs that could be assigned to the same subclass in measurements performed with two independent samples for each export factor are shown. Blue, mRNAs at least 1.5-fold underrepresented; yellow, mRNAs <1.5-fold different from the reference; red, mRNAs at least 1.5-fold overrepresented. Within these classes, the dashed areas represent subgroups of mRNAs for which more stringent cut-off values were used (at least 2-fold over- or underrepresented; <1.2-fold regulated). The total number of genes considered for each pie chart (detectable mRNAs) is indicated in italics.
None
Fig. 2. The general reduction in mRNA expression levels is a specific effect of the mRNA export inhibition. (A) A 10 µg aliquot of total or cytoplasmic RNA was analyzed by northern blot using probes to detect different selected mRNAs as indicated. Knockdown samples should be compared with the corresponding control samples isolated from cells treated in parallel with GFP dsRNA. RNA samples were isolated 2, 4 or 6 days after transfection of dsRNAs, as indicated above the lanes. The lower panel shows the corresponding rRNA stained with ethidium bromide. The signals from the northern blot were quantified using a PhosphorImager and compared with the value measured by the microarray analysis of the same RNA sample. Values are given as fold changes (positive values: overrepresented; negative values: underrepresented compared with the reference). n.d., not determined. (B and C) The expression levels of mRNAs, which were at least 2-fold up- or at least 5-fold downregulated in total samples of NXF1-depleted cells, were analyzed in p15, UAP56 and eIF4G knockdowns (B). The expression levels of mRNAs, which were at least 2-fold over- or underrepresented in total samples of eIF4G-depleted cells, were analyzed in NXF1, p15 and UAP56 knockdowns (C). RNA samples were isolated 4 or 6 days after transfection of dsRNAs, as indicated above the panels. Each mRNA is colored according to its relative expression level. The number of mRNAs displayed is indicated above the panels. The color bar indicates fold changes.
None
Fig. 3. The general reduction in mRNA expression levels is not due to increased mRNA turnover rates. (A) mRNAs that are at least 2-fold overrepresented (red) or underrepresented (blue) in the cytoplasmic samples of NXF1, p15 or UAP56 knockdowns were selected and their levels in total samples were analyzed. Each mRNA is represented as a line colored according to its relative expression level in the total RNA sample. The number of displayed mRNAs in the respective classes is indicated in brackets. The numbers in the top and bottom corners of each graph are the average relative expression levels of the respective classes. (BD) S2 cells were treated with NXF1 or GFP dsRNAs. Two or 4 days after transfection, treated or untreated cells were incubated with actinomycin D (5 µg/ml) and total RNA was isolated 0.5, 1, 3 and 6 h after the addition of the drug. The levels of selected mRNAs were determined by northern or slot blot analysis and normalized to rp49 mRNA (whose level does not change during the timescale of the experiment). Values are expressed as a percentage of the levels at time 0 (set to 100%) and plotted as a function of time. The relative expression levels of the respective mRNAs in the NXF1 knockdowns (total samples) measured by microarray analysis are given in the top right corner of each graph.
None
Fig. 4. Cells depleted of NXF1, p15 or UAP56 exhibit similar mRNA expression profiles. (A) Comparison of the relative expression levels of all detectable mRNAs (4854) in cytoplasmic samples (day 4 for NXF1, p15 and UAP56; day 5 for NXF2 and NXF3). The mRNAs are colored according to their expression levels. For each mRNA, the average levels from all measurements for each knockdown are shown. The experiment tree above was calculated using the distance option in the GeneSpring software (Euclidian distance). (B) The cytoplasmic levels of mRNAs which were at least 2-fold overrepresented, at least 2-fold underrepresented and <1.2-fold changed in cytoplasmic samples of NXF1-depleted cells (red, blue and yellow dashed areas) were analyzed in cytoplasmic samples of p15 and UAP56 knockdowns (day 4). The number of mRNAs in each class is indicated. Red, blue and yellow dashed and undashed areas are as described in Figure 1B. The ‘unclassified’ mRNAs (gray) represent transcripts that were assigned to two different subclasses in two independent microarray measurements. (C) RT–PCRs were performed with cytoplasmic RNA samples isolated from S2 cells treated with LMB for 12 h and cells depleted of NXF1 (day 4). The levels in the experimental sample should be compared with the corresponding control sample (without LMB treatment or GFP, respectively). The levels of the different mRNAs were analyzed in parallel in total RNA samples isolated from S2 cells treated with actinomycin D (5 µg/ml) for 0, 2 or 8 h. (D) The expression levels of the 20 mRNAs that were unchanged in NXF1, p15 and UAP56 knockdowns (group b) and of the nine mRNAs that were at least 1.5-fold underrepresented in the cytoplasmic samples of LMB-treated cells (group a) were analyzed in total and cytoplasmic samples of NXF1 knockdowns (day 2) and of LMB-treated cells. The seven short-lived mRNAs shown in (C) are labeled with a green star. (E) Comparison of the relative expression levels of all detectable mRNAs (4189) in cytoplasmic and total samples isolated from cells depleted of NXF1 (day 2) or treated with LMB (12 h). In (D) and (E), mRNAs are colored according to their average expression levels in measurements performed with two independent samples. The color bar is shown in (A).
None
Fig. 5. A class of mRNAs that are differentially affected in NXF1, p15 and UAP56 knockdowns. (A) List of differentially expressed mRNAs in the cytoplasm of cells depleted of NXF1, p15 and UAP56. The criteria applied to select these mRNAs can be found in Supplementary table III. The four mRNAs tested by northern blot analysis are marked with a green star. Each mRNA is colored according to its relative expression level. Note the different scale of the color bar in this figure. Spots representing the same mRNA are marked with brackets. (B) Northern blot membranes shown in Figure 2A were probed for two candidate mRNAs present in the list. The signals obtained with SD06908 and RpS12 probes were quantified and compared with the values measured in the microarray experiment using the same pool of RNAs. Symbols are as in Figure 2A.
None
Fig. 6. A block of nuclear mRNA export results in the upregulation of mRNAs encoding export factors. (A) Average relative expression values for nxf1, p15, uap56 and ref1 mRNAs determined by microarray analysis of total RNA samples isolated from NXF1, p15 and UAP56 knockdowns. The values are fold changes averaged from two different measurements for each knockdown and also averaged if several spots represent one mRNA species. (B) The values shown in (A) (day 4) were confirmed by RT–PCR with primers specific for 18S rRNA and nxf1, p15, uap56 and ref1 mRNAs. (C) S2 cells were transfected with dsRNA corresponding to GFP (control), p15 or Ssrp. Cells were fixed 10 (GFP, Ssrp) or 5 (p15) days after transfection. Poly(A)+ RNA was detected by FISH with an oligo(dT) probe (red). The nuclear envelope was stained with Alexa488-WGA (green). Two examples of Ssrp- depleted cells collected 10 days after addition of Ssrp dsRNA are shown. At this time point, >80% of cells show a strong accumulation of poly(A)+ RNA in nuclear dots, but the number and size of these dots are variable, as illustrated in the two images.

References

    1. Alén C., Kent,N.A., Jones,H.S., O’Sullivan,J., Aranda,A. and Proudfoot,N.J. (2002) A role for chromatin remodeling in transcriptional termination by RNA polymerase II. Mol. Cell, 10, 1441–1452. - PubMed
    1. Andrulis E.D., Werner,J., Nazarian,A., Erdjument-Bromage,H., Tempst,P. and Lis,J.T. (2002) The RNA processing exosome is linked to elongating RNA polymerase II in Drosophila. Nature, 420, 837–841. - PubMed
    1. Gallouzi I.E. and Steitz,J.A. (2001) Delineation of mRNA export pathways by the use of cell-permeable peptides. Science, 294, 1895–1901. - PubMed
    1. Gatfield D. and Izaurralde,E. (2002) REF1/Aly and the additional exon junction complex proteins are dispensable for nuclear export. J. Cell Biol., 159, 579–588. - PMC - PubMed
    1. Gatfield D., Le Hir,H., Schmitt,C., Braun,I.C., Kocher,T., Wilm,M. and Izaurralde,E. (2001) The DExH/D box protein HEL/UAP56 is essential for mRNA nuclear export in Drosophila. Curr. Biol., 11, 1716–1721. - PubMed

Publication types

MeSH terms