Review
. 2003 May 12;161(3):471-6.
doi: 10.1083/jcb.200301125.

Modeling network dynamics: the lac operon, a case study

Affiliations
Review

Modeling network dynamics: the lac operon, a case study

José M G Vilar et al. J Cell Biol. .

Abstract

We use the lac operon in Escherichia coli as a prototype system to illustrate the current state, applicability, and limitations of modeling the dynamics of cellular networks. We integrate three different levels of description (molecular, cellular, and that of cell population) into a single model, which seems to capture many experimental aspects of the system.


Figures
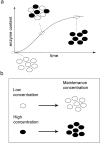
Figure 1.
Figure 1.
Different induction states. (a) All-or-none phenomenon. For low inducer concentrations, the enzyme (β-galactosidase) content of the population increases continuously in time. This increase is proportional to the number of induced cells, represented here by full ellipses. Empty ellipses correspond to uninduced cells. (b) Maintenance concentration effect. When induced cells at high inducer concentration are transferred to the maintenance concentration, they and their progeny will remain induced. Similarly, when uninduced cells at low inducer concentration are transferred to the maintenance concentration, they and their progeny will remain uninduced.
Figure 2.
Figure 2.
Three levels of description. (a) Molecular level. The three genes lacZ, lacY, and lacA are cotranscribed as a polycistronic message from a single promoter P1. The gene lacZ encodes for the β-galactosidase, which can either break down lactose into β-d-galactose and d-glucose or catalyze the conversion of lactose into allolactose, the actual inducer. The product of lacY is the β-galactoside permease, which is in charge of the uptake of lactose inside the cell. The role of LacA is not yet fully understood because its product, a galactoside acetyltransferase, is not required for lactose metabolism (Wang et al., 2002). The lac repressor is encoded by lacI, which is immediately upstream of the operon. Binding of the repressor to the main operator site O1 prevents transcription. Repression is greatly enhanced by the additional simultaneous binding of the repressor to one of the auxiliary operator sites O2 and O3. The inducer inactivates the repressor by binding to it and changing its conformation. Additionally, the CAP–cAMP complex must bind to the activator site, A, for significant transcription. (b) Cellular level. Some gratuitous inducers, such as TMG, also use the lactose permease to enter the cell; but in contrast to lactose, they bind themselves to the repressor and are not metabolized by the cell. In this case, it is possible to study the dynamics of induction by considering as variables only the internal inducer concentration, the nonfunctional permeases, and the functional permeases. (c) Population level. Coexistence of two types of networks in the lac operon is a population effect. Uninduced cells (empty circles) have some probability to become induced (full circles). If uninduced cells grow faster, both types of cells could coexist; if not, the entire population will eventually be induced.
Figure 3.
Figure 3.
Modeling results. (a) Single-cell, cell average, and population behavior. The thin (yellow, green, and blue) color lines correspond to representative time courses of β-galactosidase content obtained from computer simulations for single cells at 7 μM TMG. The observed differences in switching times from noninduced to induced states result from the stochastic behavior of the model. The thick continuous black line is the average over 2,000 cells. The dashed black line is the population β-galactosidase content. To obtain the population results, we have considered in the simulations that induced cells grow slower than uninduced ones. (b) Maintenance concentration. Representative time courses of the β-galactosidase content obtained for induced (top) and uninduced (bottom) cells transferred to the maintenance concentration (5 μM TMG) at time 0. Note the semilogarithmic scale. (c) Same as in panel a but now for cells at 500 μM TMG. In this case, the cell average and population β-galactosidase content are indistinguishable. (d) Simulation versus experiments. Induction for 500 μM TMG at the population level. The black line is the same as in panel c. Red dots represent experimental values obtained by Novick and Weiner (1957). The dashed line is the same as the black line but shifted to the left 0.33 generations. It illustrates that the main differences between simulations and experimental results come from the early stages of induction.

References

    1. Carrier, T.A., and J.D. Keasling. 1999. Investigating autocatalytic gene expression systems through mechanistic modeling. J. Theor. Biol. 201:25–36. - PubMed
    1. Cohn, M., and K. Horibata. 1959. a. Inhibition by the glucose of the induced synthesis of the β-galactoside-enzyme system of Escherichia coli–analysis of maintenance. J. Bacteriol. 78:601–612. - PMC - PubMed
    1. Cohn, M., and K. Horibata. 1959. b. Analysis of the differentiation and of the heterogeneity within a population of Escherichia coli undergoing induced β-galactoside synthesis. J. Bacteriol. 78:613–623. - PMC - PubMed
    1. Chung, J.D., and G. Stephanopoulos. 1996. On physiological multiplicity and population heterogeneity of biological systems. Chem. Eng. Science. 51:1509–1521.
    1. Delbrück, M. 1940. Statistical fluctuations in autocatalytic reactions. Journal of Chemical Physics. 8:120–124.