. 2003 May 12;161(3):593-607.
doi: 10.1083/jcb.200210166.

deep-orange and carnation define distinct stages in late endosomal biogenesis in Drosophila melanogaster

Affiliations

deep-orange and carnation define distinct stages in late endosomal biogenesis in Drosophila melanogaster

V Sriram et al. J Cell Biol. .

Abstract

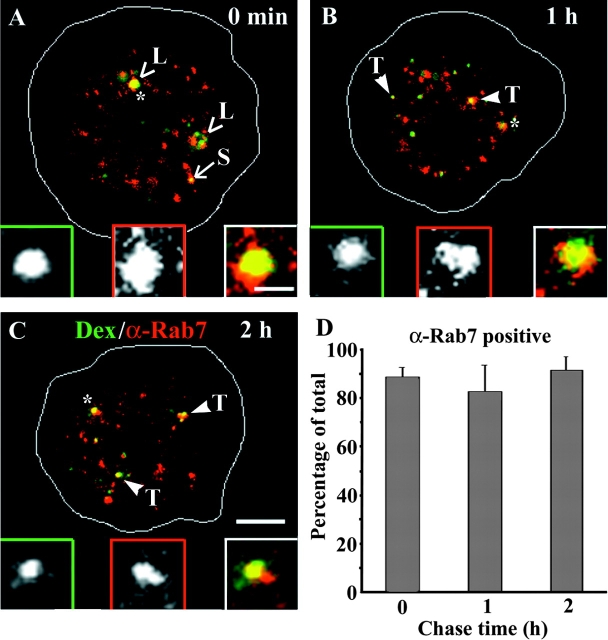
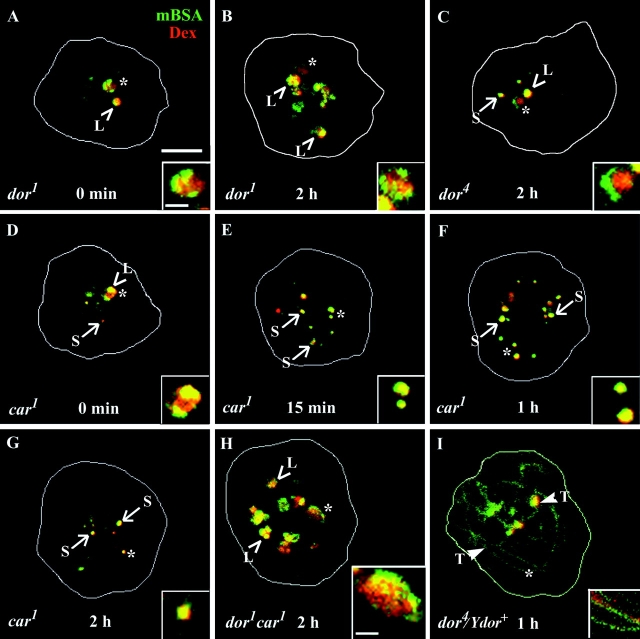
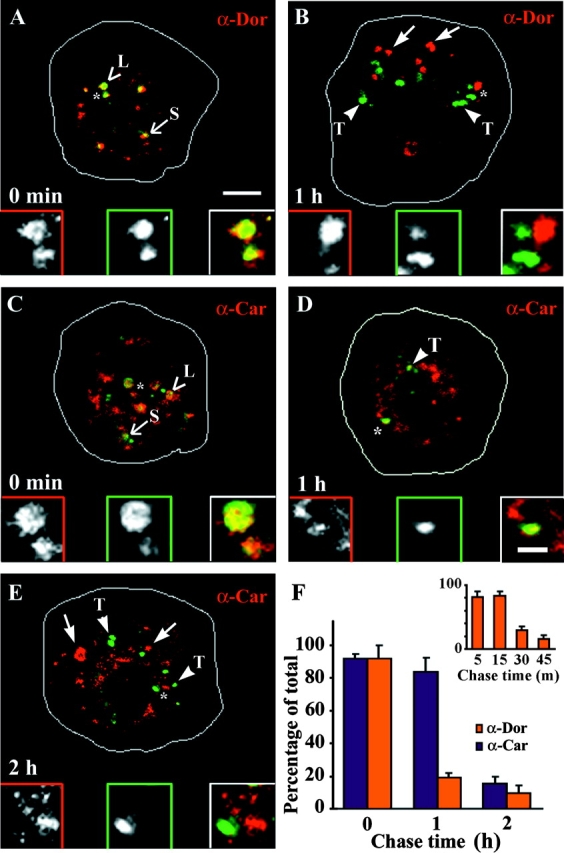
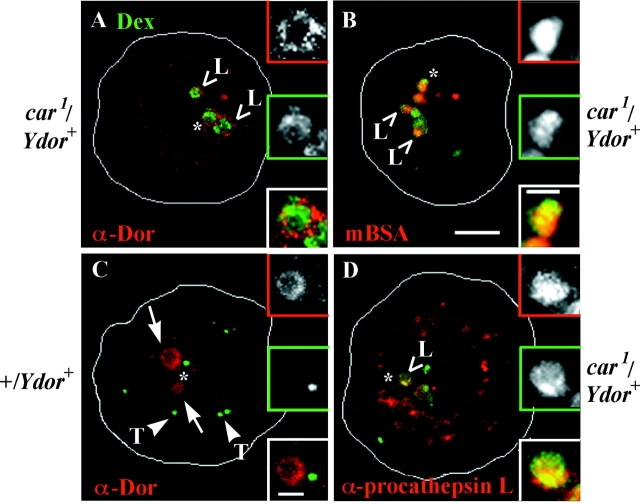
Endosomal degradation is severely impaired in primary hemocytes from larvae of eye color mutants of Drosophila. Using high resolution imaging and immunofluorescence microscopy in these cells, products of eye color genes, deep-orange (dor) and carnation (car), are localized to large multivesicular Rab7-positive late endosomes containing Golgi-derived enzymes. These structures mature into small sized Dor-negative, Car-positive structures, which subsequently fuse to form tubular lysosomes. Defective endosomal degradation in mutant alleles of dor results from a failure of Golgi-derived vesicles to fuse with morphologically arrested Rab7-positive large sized endosomes, which are, however, normally acidified and mature with wild-type kinetics. This locates the site of Dor function to fusion of Golgi-derived vesicles with the large Rab7-positive endocytic compartments. In contrast, endosomal degradation is not considerably affected in car1 mutant; fusion of Golgi-derived vesicles and maturation of large sized endosomes is normal. However, removal of Dor from small sized Car-positive endosomes is slowed, and subsequent fusion with tubular lysosomes is abolished. Overexpression of Dor in car1 mutant aggravates this defect, implicating Car in the removal of Dor from endosomes. This suggests that, in addition to an independent role in fusion with tubular lysosomes, the Sec1p homologue, Car, regulates Dor function.


Figures

Figure 1.
Figure 1.
Morphological characterization of the endocytic pathway in Drosophila larval hemocytes. (A and B) Phase–contrast (A) and fluorescence (B) images of larval hemocytes incubated with Cy3-mBSA (mBSA, 800 ng/ml; red in B) and F-Dex (Dex, 1 mg/ml; green in B) for 5 min and fixed, obtained using a wide field microscope, show that Dex and mBSA are completely colocalized in endosomes (B, inset). Uptake of Cy3-mBSA is completely competed by inclusion of unlabeled mBSA (A, inset). (C–F) Confocal images of live larval hemocytes incubated with LR-Dex (Dex, red) and A488-mBSA (mBSA, green) for 5 min were obtained either immediately (C) or after a chase period of 15 min (D), 1 h (E), or 2 h (F) without the probes. Insets in B–E show magnified view of areas marked by an asterisk. (C) Endosomes labeled by the 5-min pulse are large (1–2 μm; L, open arrowheads) in size in which Dex labels the lumen of the endosome (middle inset); occasionally intraendosomal membrane staining of mBSA (top inset) can also be seen (bottom inset). (D) In a 15-min chase, Dex (middle inset) and mBSA (top inset) label smaller compartments (0.5–1 μm; S, arrows) where the probes are completely colocalized (bottom inset). (E and F) After a 1- (E) or 2-h (F) chase, both probes remain colocalized, appearing predominantly in tubular-vesicular (T, arrowheads) endosomal compartments (Dex, middle; mBSA, top inset). Bars: (shown in B corresponds to A–F) 5 μm; 1 μm (B–D, insets); 5 μm (A and E, insets). (G) EM of hemocyte incubated with fluid phase HRP for 10 min in the presence of mannan (500 μg/ml) to prevent mannose receptor–mediated uptake of HRP. Cells were fixed and processed for EM either immediately (i–iii) or after a 50-min chase (iv). At 10 min (i and ii), HRP labels MVBs (open arrowhead) and small dense endosomes (iii, arrow). No significant electron-dense structures could be identified in cells that were processed without HRP (unpublished data) or DAB (inset, ia). At higher magnification, the multivesicular nature of the endosome (ii, small arrows, intraendosomal vesicles) and the small densely labeled compartments (iii) are more apparent. Small electron-dense compartments are also visualized by HRP product when 10-min pulse is chased for 50 min (iv, arrowhead) consistent with a fixation- induced fragmentation of tubular vesicular endosomes observed at this time (E). Bars: (G i) 500 nm; (G ia) 1 μm; (G ii–iv) 200 nm.
Figure 2.
Figure 2.
Morphology of endosomes in live and fixed cells. Hemocytes were either imaged live or after fixation following a pulse and chase protocol with Dex (red, live cells; green, fixed cells; 5-min pulse) and mBSA (green, live cells; red, fixed cells; 5-min pulse), or HRP (Ultrastructure; 10-min pulse) at the indicated chase times. Morphology of the endosomes was visualized by confocal (live cells), wide field (fixed), or electron microscopy (HRP). Bars: (5 min and 15 min; live and fixed cells) 1 μm; (1 h and 2 h; live and fixed cells) 5 μm; (Ultrastructure) 200 nm. The labels L, S, and T identify the large sized, small sized, and tubular-vesicular endosomes in all of the figures in this study.
Figure 3.
Figure 3.
Rab7 labels endolysosomes in larval hemocytes. (A–C) Hemocytes incubated with F-Dex for 15 min were fixed either immediately (A) or, after a 1- (B) or 2-h (C) chase period in the absence of endocytic probe, immunostained for Rab7 and imaged on a confocal microscope. Images show that Rab7 (red; middle insets) labels different stages of the endosomal system accessed by endocytosed F-Dex (green, left insets) after indicated chase times. Insets show a magnified view of areas marked by an asterisk. (D) Histogram shows the percentage of F-Dex– containing endosomes per cell colocalized with immunolocalized Rab7. The results shown represent the mean ± SEM obtained from two experiments. Bars: (shown in C corresponds to A–C) 5 μm; (insets) 1 μm.
Figure 4.
Figure 4.
Multivesicular late endosomes mature into small dense organelles in hemocytes from wild-type animals. (A and B) Hemocytes derived from wild-type larvae were incubated according to the pulse–chase–pulse protocol outlined in A with F-Dex (green) as first pulse and Cy3-mBSA (red) as second pulse, fixed, and imaged on wide-field microscope. (B) Outline of the predictions of maturation (left) and vesicle shuttle (right) models. This is in terms of kinetics of loss of fusion accessibility (top) and the change in ratio of amount of the first pulse to amount of colocalized second pulse in an endosome as a function of chase time (bottom). (C–F) Comparison of a 5- (C; F-Dex, middle; mBSA, top inset) with a 45-min chase time (D; F-Dex, arrow; mBSA, open arrowhead) between the two probes shows that the percentage of endosomes containing first probe and accessible to second probe reduces with increasing chase times. Insets in C and D show magnified views of areas marked by an asterisk. Histograms show kinetics of loss of fusion accessibility (E) and the relative ratio of amount of first pulse remaining in an endosome to amount of colocalized second pulse in the same endosome as a function of chase time (F). The data in E and F represent the median ± SD derived from two experiments. Bars: (shown in C corresponds to C and D) 5 μm; (insets) 1 μm.
Figure 5.
Figure 5.
Endosomal degradation in hemocytes from wild-type and eye color mutant animals. (A) Hemocytes from wild-type (top) and dor 1 car1 (bottom) animals were incubated with Cy3-mBSA for 5 min, fixed either immediately (left) or after a 2-h chase (right), and imaged on a wide field microscope. Note the loss in endosomal fluorescence in hemocytes from wild-type compared with dor 1 car1 after a 2-h chase. (B) Histogram shows quantification of total cell- associated fluorescence of Cy3-mBSA at indicated chase times normalized to cell-associated fluorescence at the 5-min time point. (C) Histogram shows quantification of total cell-associated fluorescence of Cy3-mBSA at 2 h of chase normalized to cell-associated fluorescence at the 5-min time point on treating wild-type cells with a protease inhibitor cocktail or in different alleles as indicated. The differences observed in endosomal degradation between cells from Canton-S and all other alleles were significant (P < 0.0001). (D) Histogram shows relative extent of endosomal acidification in cells from indicated mutants, incubated with F-Dex for 5 min, and imaged live, either immediately (0) or after a 2-h chase period (2) on a wide field microscope. Extent of endosomal acidification is expressed as a ratio of FITC fluorescence before neutralization of endosomal pH normalized to FITC fluorescence after neutralization with nigericin. The results shown represent the mean ± SD from two experiments. Bar: 5 μm.
Figure 6.
Figure 6.
Hemocytes from mutant alleles of dor and car show block in distinct stages of endolysosomal traffic. Hemocytes from indicated mutants were incubated with LR-Dex (red) and A488-mBSA (green) for 5 min, and the morphology of endosomes was visualized by confocal microscopy in living cells either immediately (A and D) or after indicated chase times (B, C, and E–I). In cells from mutant alleles of dor and car, 5-min endosomes (A and D) contain both probes. Cells from dor 1 and dor 1 car1 do not show endosomal morphological transformation into small sized endosomes even at long chase times (B and H, open arrowheads), whereas endosomes in cells from car 1 undergo rapid morphological transition into small dense organelles (E, arrows) but fail to elaborate tubular structures at longer chase times (F and G). Cells from dor 4 show a marginal endosomal morphological transformation into small sized compartments (arrow) at longer chase times (C, open arrowhead indicates the large compartment). This defect is completely rescued in cells from dor 4/Ydor + (I, arrowhead, tubular- vesicular compartments). Insets in all panels show magnified view of areas marked by an asterisk. Bars: (shown in A corresponds to A–I) 5 μm; (insets) 1 μm.
Figure 7.
Figure 7.
Mutant alleles of dor fail to deliver Golgi-derived hydrolase to endosomes. Hemocytes from wild-type (A and B), car 1 (C), dor 1 (D), and dor 1 car1 (E) incubated with F-Dex (green) for 5 (A) or 15 (B–E) min were fixed and immunostained with antiserum against pro–cathepsin L (α-proCathepsin L; red) either immediately (A) or after 2 h (B–E) and imaged on a confocal microscope. Insets in A–E show magnified views of areas marked by an asterisk (α-proCathepsin L, top; F-Dex, middle inset). Note the accumulation of large ring-like organelles containing pro–cathepsin L in the dor alleles (D and E, bold arrows). Histogram in F shows the percentage of F-Dex–containing endosomes colocalized with pro–cathepsin L at the indicated chase times in different alleles. Note the complete rescue of defect in fusion of Golgi-derived vesicles with endosomes in hemocytes from dor 4/Ydor +. The results represent the mean ± SEM derived from two experiments. Bars: (shown in E corresponds to A–E) 5 μm; (insets) 1 μm.
Figure 8.
Figure 8.
Localization of Deep-orange and Carnation within the late endolysosomal system in larval hemocytes. (A–E) Hemocytes incubated with F-Dex (green) for 15 min were fixed and immunostained (red) for Deep-orange (α-Dor) or Carnation (α-Car) either immediately (A and C) or after the indicated chase times (B, D, and E), and imaged on a confocal microscope. Insets show magnified views of the area marked by an asterisk (left, antibody; middle, F-Dex; right, merge). (F) Histogram shows the percentage of F-Dex–containing endosomes colocalized with α-Dor (orange) or α-Car (purple) at the indicated chase times. Histogram in the inset shows percentage of F-Dex–containing endosomes colocalized with α-Dor at shorter chase times. The results shown represent mean ± SEM from three experiments. Bar: (shown in A corresponds to A–E) 5 μm; (insets) 1 μm.
Figure 9.
Figure 9.
Eye color mutants affect the removal of Dor and Car from Rab7-positive endosomes. (A–F) Hemocytes from mutants of dor and car, synthetic lethal dor 1 car1, and dor 4/Ydor + were incubated for 15 min with F-Dex (green) and fixed after indicated chase times, immunostained (red) for Deep-orange (α-Dor), and imaged on a confocal microscope. Insets in A–D show magnified view of areas marked by an asterisk (top, antibody; middle, F-Dex; bottom, merge). Bold arrows (E and F) indicate antibody-stained structures lacking endocytic probes. (G and H) Histograms show the percentage of F-Dex–containing endosomes colocalized with α-Dor (G) or α-Car (H) at the indicated chase times in wild-type (blue), dor 1 (green), dor 4 (yellow), dor 1 car1(red), and car 1 (gray). The results shown represent the mean ± SEM from two experiments. Bars: (shown in F corresponds to A–F) 5 μm; (inset) 1 μm.
Figure 10.
Figure 10.
Endosomal membrane association of Dor and morphological progression in car1/Ydor + . (A, C, and D) Hemocytes from car 1/Ydor + (A and D) and +/Ydor + (C) were incubated with F-Dex (green) for 15 min followed by a chase of 2 h, fixed and immunostained (red) for Deep-orange (α-Dor; A and C) or pro–cathepsin L (α-proCathepsin L; D), and imaged on a confocal microscope. Insets in A, C, and D show magnified views of areas marked by an asterisk (top, antibody; middle, F-Dex; bottom, merge). Bold arrows indicate antibody-stained structures lacking endocytic probes. (B) Cells from car 1/Ydor + were incubated with LR-Dex (red) and A488-mBSA (green) for 5 min, and morphology of endosomes was visualized after a 2-h chase by confocal microscopy in living cells. Insets show magnified views of areas marked by an asterisk (top, Dex; middle, mBSA; bottom, merge). Bars: (shown in B corresponds to A–D) 5 μm; (insets) 1 μm.
Figure 11.
Figure 11.
Schematic of the biogenesis of Rab7-positive endolysosomal system in Drosophila hemocytes. The Drosophila scavenger receptor and markers of the fluid phase are internalized by independent endocytic pathways (Guha et al., 2003) and subsequently colocalize in Rab7-positive MVBs in a 5-min pulse of the two probes. These structures are Dor- and Car-positive and are capable of fusion. Multivesicular late endosomes are also accessed by Golgi-derived pro–cathepsin L via a heterotypic fusion reaction. They mature into smaller electron-dense organelles (t 1/2 ∼12 min) and subsequently lose Dor reactivity but remain Car positive. This organelle eventually fuses with a tubular-vesicular Rab7-positive structure; at 2 h the degradation-competent tubular vesicular lysosomes are devoid of Car. Dor (and possibly Car) plays a specific role in endosomal delivery of Golgi- derived cargo (heterotypic fusion). Car regulates Dor membrane association; modulation of Dor governs the morphological progression of the multivesicular bodies to small sized organelles. Car is also involved independent of Dor in fusion of small sized endosomes with tubular lysosomal components. Colored boxes to the left of the model indicate molecular labels of the morphologically distinct endosomes.

Similar articles

Cited by

References

    1. Antonin, W., C. Holroyd, D. Fasshauer, S. Pabst, G.F. Von Mollard, and R. Jahn. 2000. A SNARE complex mediating fusion of late endosomes defines conserved properties of SNARE structure and function. EMBO J. 19:6453–6464. - PMC - PubMed
    1. Babst, M., G. Odorizzi, E.J. Estepa, and S.D. Emr. 2000. Mammalian tumor susceptibility gene 101 (TSG101) and the yeast homologue, Vps23p, both function in late endosomal trafficking. Traffic. 1:248–258. - PubMed
    1. Banta, L.M., J.S. Robinson, D.J. Klionsky, and S.D. Emr. 1988. Organelle assembly in yeast: characterization of yeast mutants defective in vacuolar biogenesis and protein sorting. J. Cell Biol. 107:1369–1383. - PMC - PubMed
    1. Braun, A., J.A. Hoffmann, and M. Meister. 1998. Analysis of the Drosophila host defense in domino mutant larvae, which are devoid of hemocytes. Proc. Natl. Acad. Sci. USA. 95:14337–14342. - PMC - PubMed
    1. Bryant, N.J., and T.H. Stevens. 1998. Vacuole biogenesis in Saccharomyces cerevisiae: protein transport pathways to the yeast vacuole. Microbiol. Mol. Biol. Rev. 62:230–247. - PMC - PubMed

Publication types

MeSH terms