. 2003 Jun;121(6):529-40.
doi: 10.1085/jgp.200308794. Epub 2003 May 12.

Pore structure influences gating properties of the T-type Ca2+ channel alpha1G

Affiliations

Pore structure influences gating properties of the T-type Ca2+ channel alpha1G

Karel Talavera et al. J Gen Physiol. 2003 Jun.

Abstract

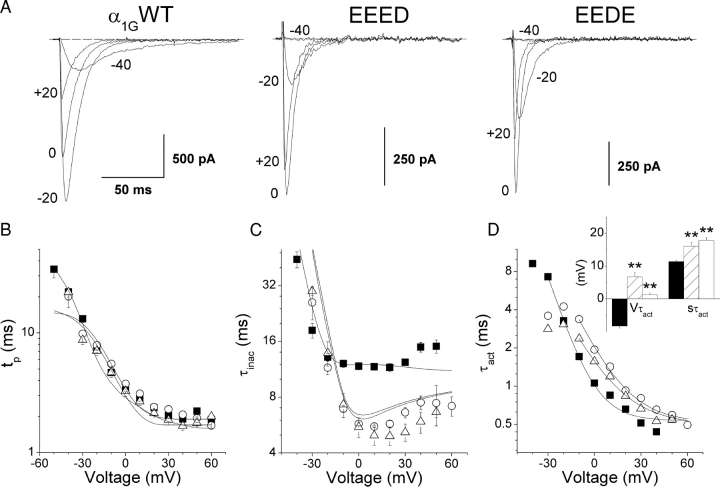
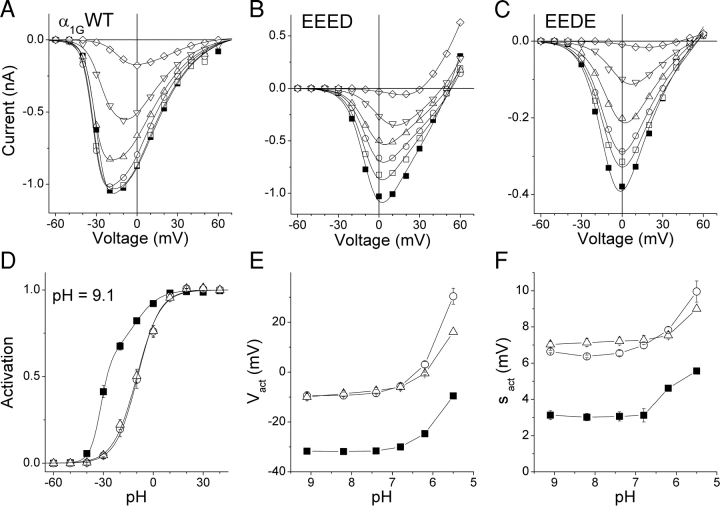
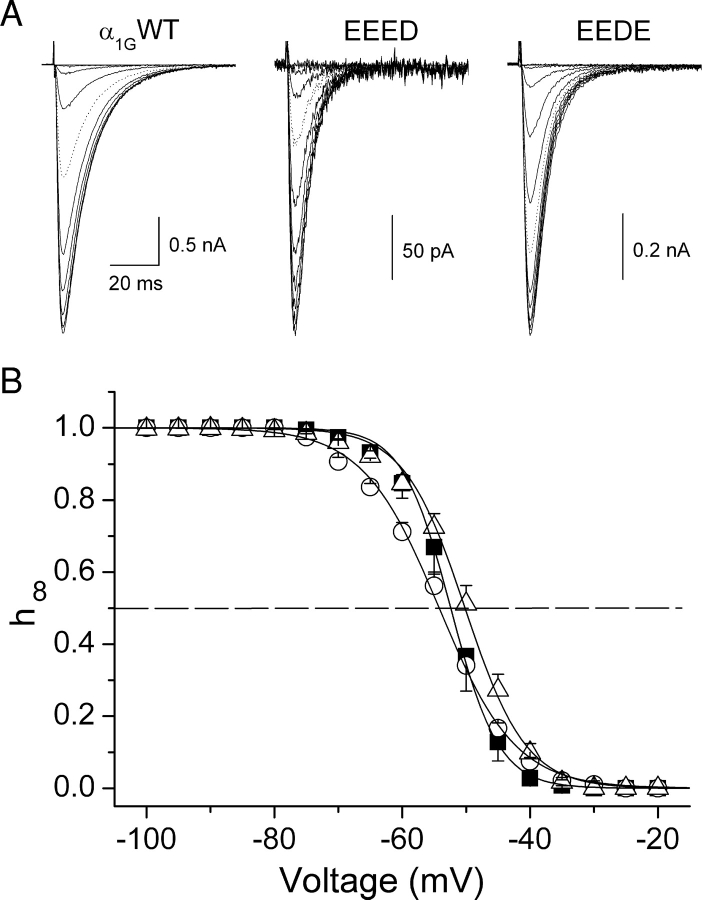
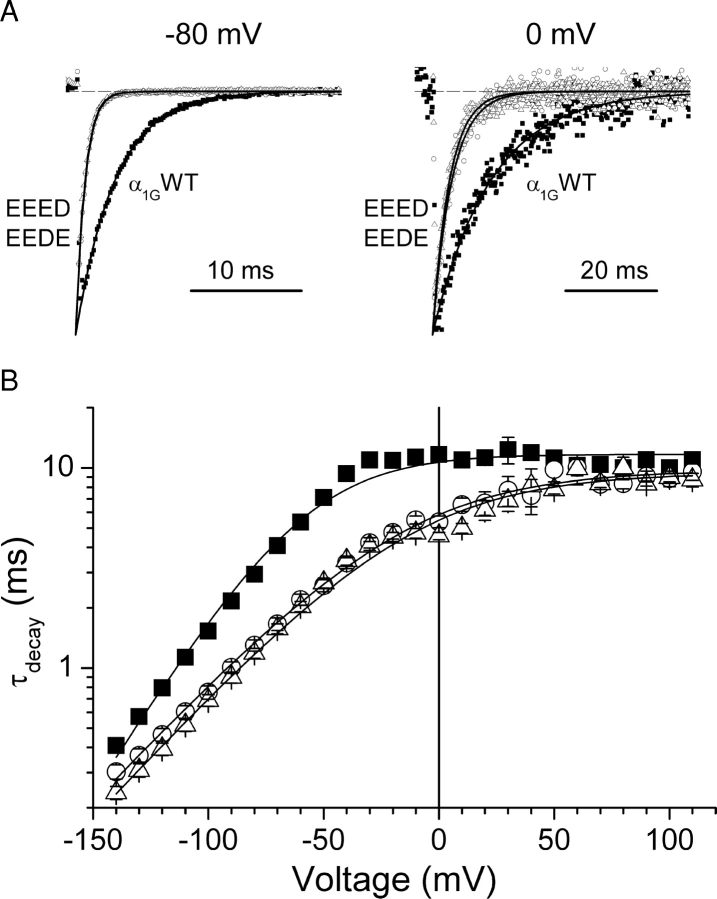
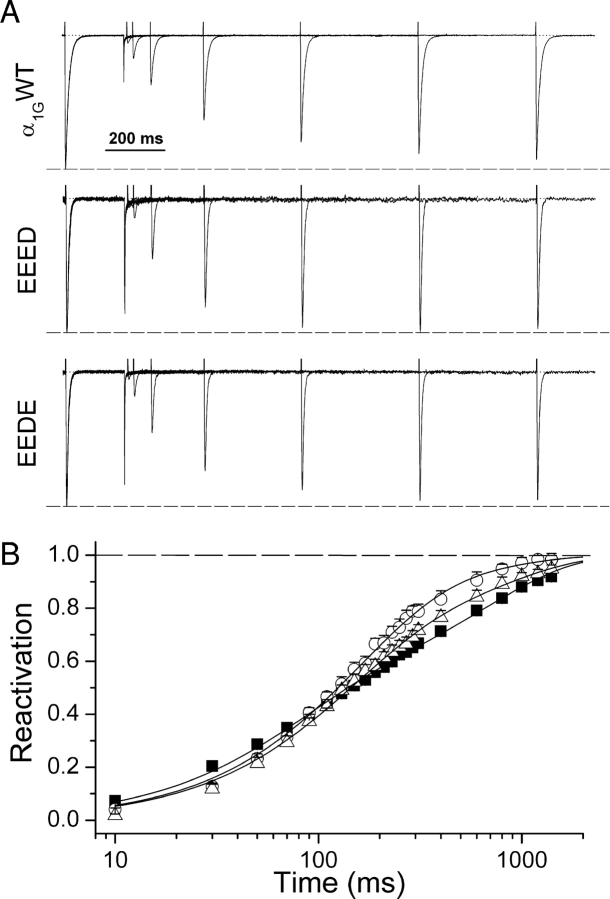
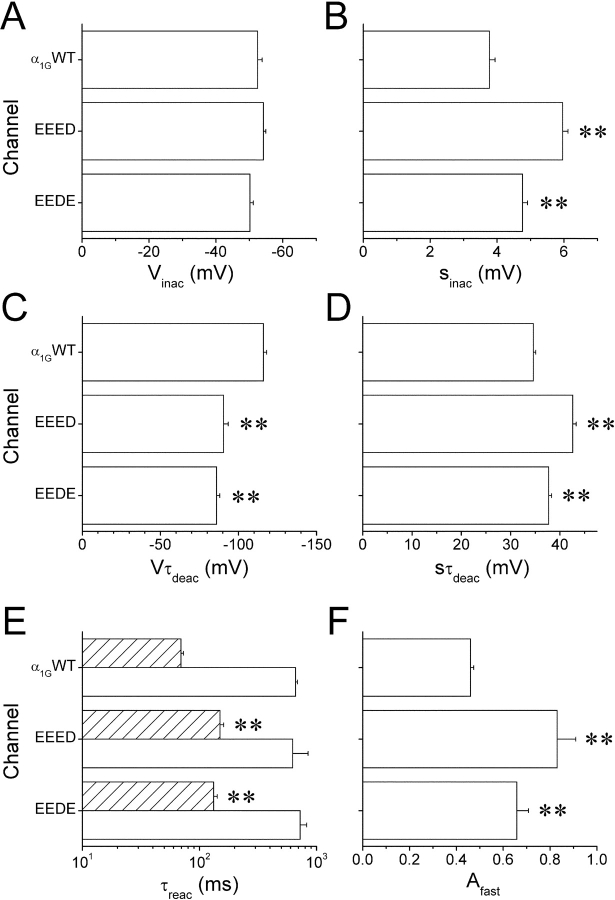
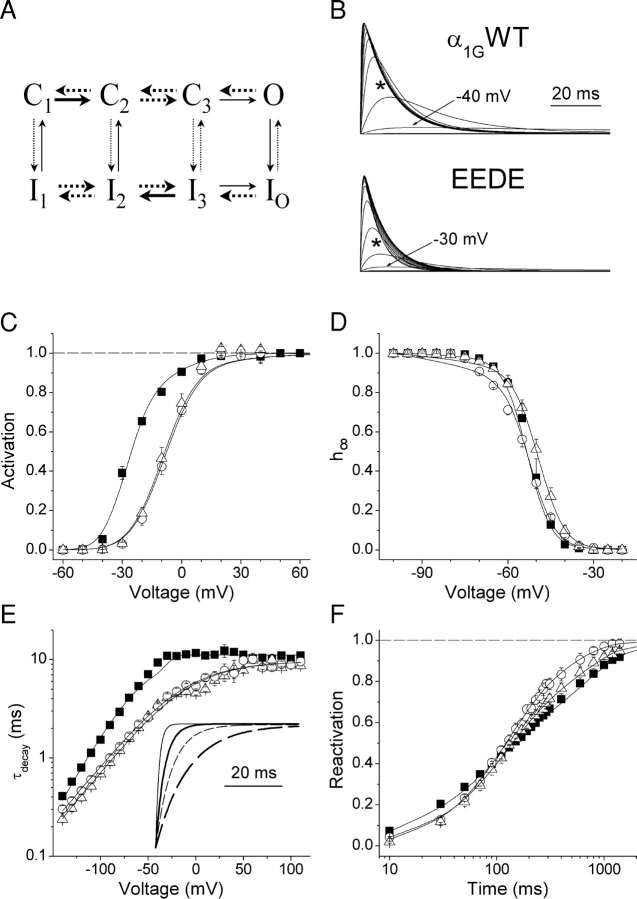
The selectivity filter of all known T-type Ca2+ channels is built by an arrangement of two glutamate and two aspartate residues, each one located in the P-loops of domains I-IV of the alpha1 subunit (EEDD locus). The mutations of the aspartate residues to glutamate induce changes in the conduction properties, enhance Cd2+ and proton affinities, and modify the activation curve of the channel. Here we further analyze the role of the selectivity filter in the gating mechanisms of T-type channels by comparing the kinetic properties of the alpha1G subunit (CaV3.1) to those of pore mutants containing aspartate-to-glutamate substitution in domains III (EEED) or IV (EEDE). The change of the extracellular pH induced similar effects on the activation properties of alpha1G and both pore mutants, indicating that the larger affinity of the mutant channels for protons is not the cause of the gating modifications. Both mutants showed alterations in several gating properties with respect to alpha1G, i.e., faster macroscopic inactivation in the voltage range from -10 to 50 mV, positive voltage shift and decrease in the voltage sensitivity of the time constants of activation and deactivation, decrease of the voltage sensitivity of the steady-state inactivation, and faster recovery from inactivation for long repolarization periods. Kinetic modeling suggests that aspartate-to-glutamate mutations in the EEDD locus of alpha1G modify the movement of the gating charges and alter the rate of several gating transitions. These changes are independent of the alterations of the selectivity properties and channel protonation.


Figures

F<sc>igure</sc> 1.
Figure 1.
Comparison of activation and inactivation kinetics for α1G and the pore mutants. (A) Current traces recorded from typical cells expressing α1G or the EEED or EEDE pore mutants during voltage steps to the potentials indicated by the labels. B and C show the voltage dependences of the average time to peak (t p) and the average time constant of macroscopic inactivation (τinac), respectively, for α1G (▪, N = 11) and the EEED (○, N = 8) and EEDE (▵, N = 6) pore mutants. Continuous lines are the voltage dependences of t p and τinac predicted by the kinetic models for α1G and the pore mutants (see discussion). (D) Estimated time constant of activation as function of test potential; solid lines are the fit of experimental data with Eq. 4 from which the average Vτact and sτact shown in the inset were obtained (α1G, filled bars; EEED, dashed bars; and EEDE, empty bars). The double asterisks denote significant difference from the values obtained for α1G with P < 0.01.
F<sc>igure</sc> 2.
Figure 2.
Effects of extracellular protons on the I-V curves of α1G and the pore mutants. (A–C) I-V curves obtained from typical cells expressing α1G or the EEED or the EEDE pore mutants, respectively, at different pHe (9.1, ▪; 8.2, □; 7.4, ○; 6.8, ▵; 6.2, ▿; 5.5, ⋄). (D) Activation curves of α1G (▪, n = 7), EEED (○, n = 8) and EEDE (▵, n = 6) at pHe 9.1. (E and F) pHe dependence of the voltage for half-maximal activation (V act) and the slope factor of the activation (s act), respectively (same legend as in D).
F<sc>igure</sc> 3.
Figure 3.
Voltage dependence of steady-state inactivation of α1G and the pore mutants. (A) Typical current traces recorded during the application of the steady-state inactivation protocol in cells expressing α1G or the EEED or EEDE pore mutants. The dotted traces correspond to the prepulse to −50 mV. Average voltage dependence of the steady-state inactivation of α1G (▪, n = 6), EEED (○, n = 5) and EEDE (▵, n = 10). Continuous lines are the inactivation curves calculated from Eq. 5 using the average values of V inac and s inac determined for each channels type.
F<sc>igure</sc> 4.
Figure 4.
Aspartate-to-glutamate mutations in the selectivity filter of α1G induced faster deactivation kinetics. (A) Typical tail current traces recorded at −80 mV (left) or at 0 mV (right) from cells expressing α1G or the EEED or EEDE mutant channels. (B) Voltage dependence of average time constant of the decay (τdecay) of tail currents recorded after 7.5-ms depolarization to 100 mV for α1G (▪, n = 14) and the EEED (○, n = 11) and EEDE (▵, n = 12) mutants. Continuous lines are functions of the form of Eq. 6 calculated using the average values of Vτdeac and sτdeac determined for each channel type.
F<sc>igure</sc> 5.
Figure 5.
Reactivation kinetics of α1G and the pore mutants. (A) current traces recorded during the application of the reactivation protocol to typical cells expressing α1G or the EEED or EEDE pore mutants. (B) Average reactivation curves of α1G (▪, n = 6) and the EEED (○, n = 8) and EEDE (▵, n = 8) mutants. Continuous lines are the fit of the experimental points to Eq. 7.
F<sc>igure</sc> 6.
Figure 6.
Summary of gating properties of the EEED and EEDE mutants compared with the α1G channel. (A) Average voltage for half-maximal inactivation (V inac). (B) Slope factor of the voltage dependence of the steady-state inactivation (s inac). (C) Voltage at which τdeac is equal to 1 ms (Vτdeac). (D) Voltage sensitivity of the time constant of deactivation (sτdeac). (E) Average fast (τfast, dashed bars) and slow (τslow, empty bars) time constants of recovery from inactivation. (F) Probability for the channels to reactivate via the fast component, A fast. (**), denote significant difference respect to the values obtained for the wild-type α1G with P < 0.01.
F<sc>igure</sc> 7.
Figure 7.
Simulation of the gating of α1G and the EEED and EEDE pore mutants. (A) Markov model used to describe the gating properties of the wild-type and both pore mutants. The thick arrows represent voltage-dependent transitions and the dotted arrows denote the transitions that are significantly different in the mutants with respect to α1G. (B) predicted time course of the open probability of α1G and the EEDE mutant during voltage steps in the range of −60 to 90 mV from a holding potential of −100 mV. The asterisks denote that the EEDE mutant shows faster macroscopic inactivation than the wild type in the voltage range from −10 to 50 mV. The same occurred for the EEED mutant (Fig. 1 C). C–F show the fit of average activation, steady-state inactivation, voltage dependence of τdecay and reactivation curves, respectively, for α1G (▪) and the EEED (○) and EEDE (▵) pore mutants. The inset in E shows simulated tail currents corresponding to repolarization potentials of −80 (continuous lines) or 0 mV (dashed lines) for α1G (thick lines) and EEDE (thin lines) pore mutant.

Similar articles

Cited by

References

    1. Alvarez, J.L., A. Artiles, K. Talavera, and G. Vassort. 2000. Modulation of voltage-dependent facilitation of the T-type calcium current by sodium ion in isolated frog atrial cells. Pflugers Arch. 441:39–48. - PubMed
    1. Balser, J.R., H.B. Nuss, N. Chiamvimonvat, M.T. Perez-Garcia, E. Marban, and G.F. Tomaselli. 1996. External pore residue mediates slow inactivation in μ1 rat skeletal muscle sodium channels. J. Physiol. 494:431–442. - PMC - PubMed
    1. Becker, D., I. Dreyer, S. Hoth, J.D. Reid, H. Busch, M. Lehnen, K. Palme, and R. Hedrich. 1996. Changes in voltage activation, Cs+ sensitivity, and ion permeability in H5 mutants of the plant K+ channel KAT1. Proc. Natl. Acad. Sci. USA. 93:8123–8128. - PMC - PubMed
    1. Benitah, J.P., Z. Chen, J.R. Balser, G.F. Tomaselli, and E. Marban. 1999. Molecular dynamics of the sodium channel pore vary with gating: interactions between P-segment motions and inactivation. J. Neurosci. 19:1577–1585. - PMC - PubMed
    1. Benitah, J.P., R. Ranjan, T. Yamagishi, M. Janecki, G.F. Tomaselli, and E. Marban. 1997. Molecular motions within the pore of voltage-dependent sodium channels. Biophys. J. 73:603–613. - PMC - PubMed

Publication types