

Biocomplexity and fisheries sustainability
- PMID: 12743372
- PMCID: PMC164486
- DOI: 10.1073/pnas.1037274100
Biocomplexity and fisheries sustainability
Abstract
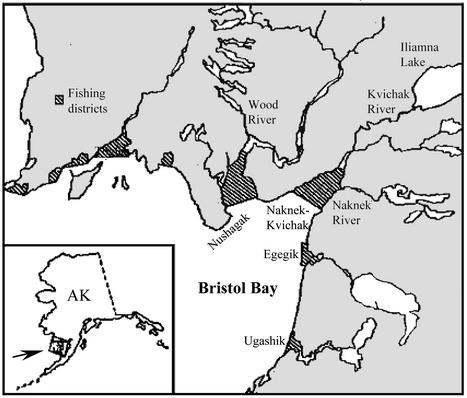
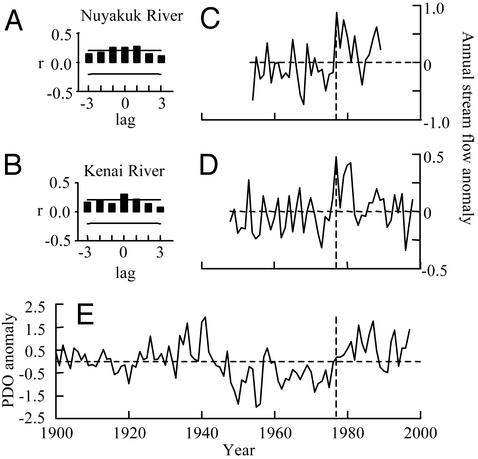
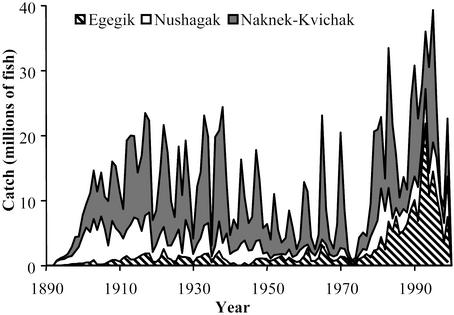
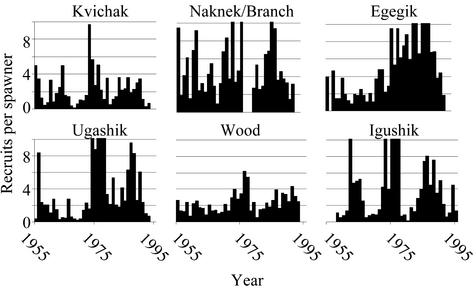
A classic example of a sustainable fishery is that targeting sockeye salmon in Bristol Bay, Alaska, where record catches have occurred during the last 20 years. The stock complex is an amalgamation of several hundred discrete spawning populations. Structured within lake systems, individual populations display diverse life history characteristics and local adaptations to the variation in spawning and rearing habitats. This biocomplexity has enabled the aggregate of populations to sustain its productivity despite major changes in climatic conditions affecting the freshwater and marine environments during the last century. Different geographic and life history components that were minor producers during one climatic regime have dominated during others, emphasizing that the biocomplexity of fish stocks is critical for maintaining their resilience to environmental change.
Figures
References
-
- Taylor, E. B. (1991) Aquaculture 98, 185–207.
-
- Dittman, A. H. & Quinn, T. P. (1996) J. Exp. Biol. 199, 83–91. - PubMed
-
- Wood, C. C. (1995) in Evolution and the Aquatic Ecosystem: Defining Unique Units in Population Conservation, ed. Neilsen, J. L. (Am. Fisheries Soc., Bethesda), pp. 195–216.
-
- Demory, R. L., Orrell, R. F. & Heinle, D. R. (1964) Spawning Ground Catalog of the Kvichak River System, Bristol Bay, Alaska (U. S. Fish and Wildlife Service, Washington, DC), Special Science Report, Fisheries No. 488.
-
- Marriott, R. A. (1964) Stream Catalog of the Wood River Lake System, Bristol Bay, Alaska (U. S. Fish and Wildlife Service, Washington, DC), Special Science Report, Fisheries No. 494.
Publication types
MeSH terms
LinkOut - more resources
Full Text Sources
