. 2003 May 27;100(11):6347-52.
doi: 10.1073/pnas.1131959100. Epub 2003 May 13.

Specificity of short interfering RNA determined through gene expression signatures

Affiliations

Specificity of short interfering RNA determined through gene expression signatures

Dimitri Semizarov et al. Proc Natl Acad Sci U S A. .

Abstract

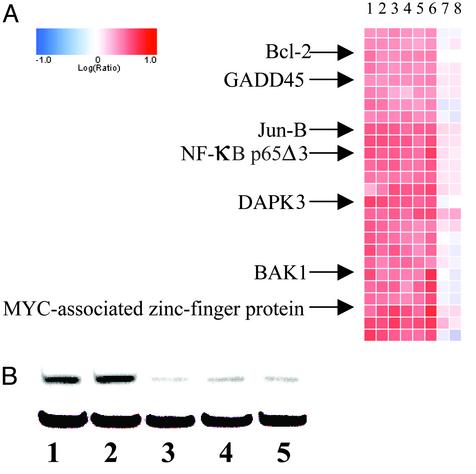
Short interfering RNA (siRNA) is widely used for studying gene function and holds great promise as a tool for validating drug targets and treating disease. A critical assumption in these applications is that the effect of siRNA on cells is specific, i.e., limited to the specific knockdown of the target gene. In this article, we characterize the specificity of siRNA by applying gene expression profiling. Several siRNAs were designed against different regions of the same target gene for three different targets. Their effects on cells were compared by using DNA microarrays to generate gene expression signatures. When the siRNA design and transfection conditions were optimized, the signatures for different siRNAs against the same target were shown to correlate very closely, whereas the signatures for different genes revealed no correlation. These results indicate that siRNA is a highly specific tool for targeted gene knockdown, establishing siRNA-mediated gene silencing as a reliable approach for large-scale screening of gene function and drug target validation.


Figures

Fig. 1.
Fig. 1.
(A) Fragment of a heat map created by hierarchical clustering of the following gene expression profiles: H1299 cells transfected with 100 nM scrambled control siRNA (lanes 1 and 2); 100 nM siRNA against Chk1 (lane 3), AKT1 (lane 4), and Rb (lanes 5 and 6); and 5 nM (lane 7) and 20 nM (lane 8) siRNA against Rb. (B) Western blot of the Rb protein (upper band) in H1299 cells transfected with 5 nM (lane 3), 20 nM (lane 4), and 100 nM (lane 5) Rb siRNA 112. Untransfected H1299 cells (lane 1) and cells transfected with random-sequence scrambled siRNA (lane 2) were used as controls. Actin was used as loading control (lower band).
Fig. 2.
Fig. 2.
Characterization of Rb siRNAs. (A) Q-RT-PCR analysis of Rb mRNA knockdown in H1299 cells by siRNAs 112 (lane 3), 114 (lane 4), 1308 (lane 5), 1310 (lane 6), and 1314 (lane 7). (B) Western blot analysis of the Rb protein knockdown in H1299 cells by siRNAs 112 (lane 3), 114 (lane 4), 1308 (lane 5), 1310 (lane 6), and 1314 (lane 7). The numbers were normalized to the no-siRNA control (lane 1). Random-sequence, or “scrambled,” siRNA (lane 2) was also used as a negative control.
Fig. 3.
Fig. 3.
Scaled-down representation of the heat map obtained by hierarchical clustering of the gene expression profiles for multiple siRNAs against Rb (A), AKT1 (B), and Plk1 (C). Each color patch in the matrix represents the expression fold change of the associated gene relative to the untreated control: red indicates up-regulation and blue indicates down-regulation, as shown by the color bar. (A) Signatures for siRNAs 112 (lanes 1 and 2), 114 (lanes 7 and 8), 1308 (lanes 3 and 10), 1310 (lanes 4 and 5), and 1314 (lanes 6 and 9) against Rb run in duplicate. (B) Signatures for siRNAs 1286 (lanes 1 and 3), 1288 (lanes 7 and 8), 1290 (lanes 5 and 6), 29 (lanes 2 and 4), and 31(lanes 9 and 10) against AKT1 run in duplicate. (C) Signatures for siRNAs 1378 (lanes 1 and 2), 1386 (lanes 7 and 8), 1406 (lanes 3 and 10), 1408 (lanes 4 and 9), and 1410 (lanes 5 and 6) against Plk1 run in duplicate.
Fig. 4.
Fig. 4.
Correlation between gene expression signatures. The red data points represent the signature of the x-axis experiment, and the green data points represent the signature of the y-axis experiment. The yellow data points belong to the common signature (P ≤ 0.01). (A) Replicates of the siRNA 112 experiment. (B) Rb siRNA 112 vs. Rb siRNA 114. (C) AKT1 siRNA 1286 vs. AKT1 siRNA 1290. (D) Plk1 siRNA 1410 vs. Plk1 siRNA 1408.
Fig. 5.
Fig. 5.
Correlation between gene expression signatures for siRNAs against Rb and AKT1 (A), Rb and Plk1 (B), and AKT1 and Plk1 (C). (D) Venn diagram representing the overlap between the gene expression signatures for the Rb, AKT1, and Plk1 siRNAs.

Comment in

References

    1. McManus, M. T. & Sharp, P. A. (2002) Nat. Rev. Genet. 10, 737–747. - PubMed
    1. Caplen, N. J., Parrish, S., Imani, F., Fire, A. & Morgan, R. (2001) Proc. Natl. Acad. Sci. USA 98, 9742–9747. - PMC - PubMed
    1. McManus, M., Haines, B., Dillon, C. P., Whitehurst, C. E., van Parijs, L., Chen, J. & Sharp, P. A. (2002) J. Immunol. 169, 5754–5760. - PubMed
    1. Prasanth, S. G., Prasanth, K. V. & Stillman, B. (2002) Science 297, 1026–1031. - PubMed
    1. DiTullio, R. A., Mochan, T. A., Venere, M., Bartkova, J., Sehested, M., Bartek, J. & Halazonetis, T. D. (2002) Nat. Cell Biol. 4, 998–1002. - PubMed

MeSH terms

Substances