Comparative Study
. 2003 May;24(5):862-71.

Measurement of cerebral blood flow in chronic carotid occlusive disease: comparison of dynamic susceptibility contrast perfusion MR imaging with positron emission tomography

Affiliations
Comparative Study

Measurement of cerebral blood flow in chronic carotid occlusive disease: comparison of dynamic susceptibility contrast perfusion MR imaging with positron emission tomography

Pratik Mukherjee et al. AJNR Am J Neuroradiol. 2003 May.

Abstract

Background and purpose: Our purpose was to evaluate the accuracy of cerebral blood flow (CBF) measurements obtained by using dynamic susceptibility contrast-enhanced MR imaging, including the influence of arterial input function (AIF) selection, compared with those obtained by using [(15)O]-H(2)O positron emission tomography (PET) for patients with chronic carotid occlusion.

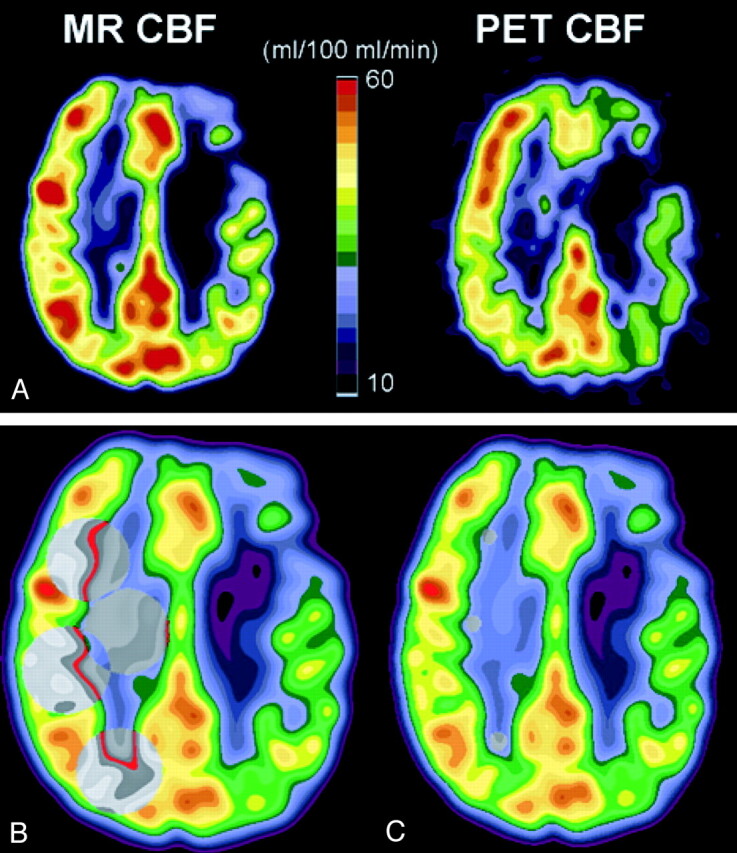
Methods: MR images and PET scans were obtained of seven patients with unilateral carotid occlusion and were co-registered for region of interest analysis. PET CBF maps were generated by using the autoradiographic method. MR imaging CBF maps were calculated by deconvolution of the susceptibility time curve with a proximal middle cerebral artery AIF and were converted to absolute flow rates either by assuming a constant contralateral white matter CBF value of 22 mL/100 mL/min or by using individually determined PET white matter CBF values.

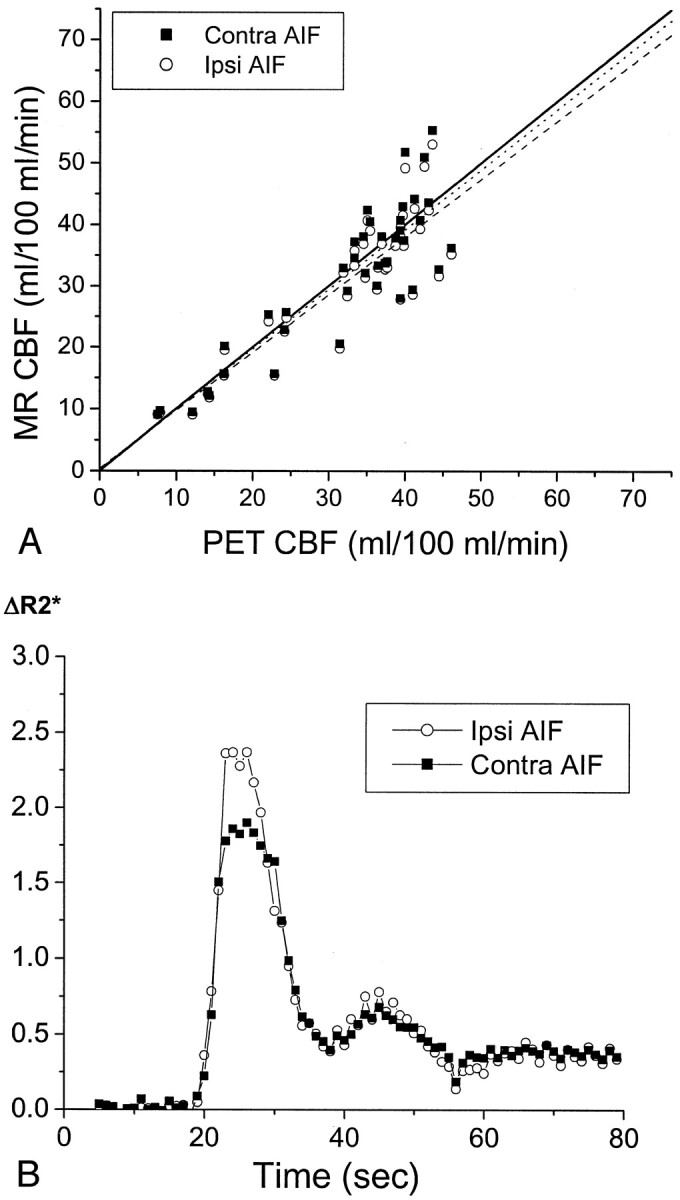
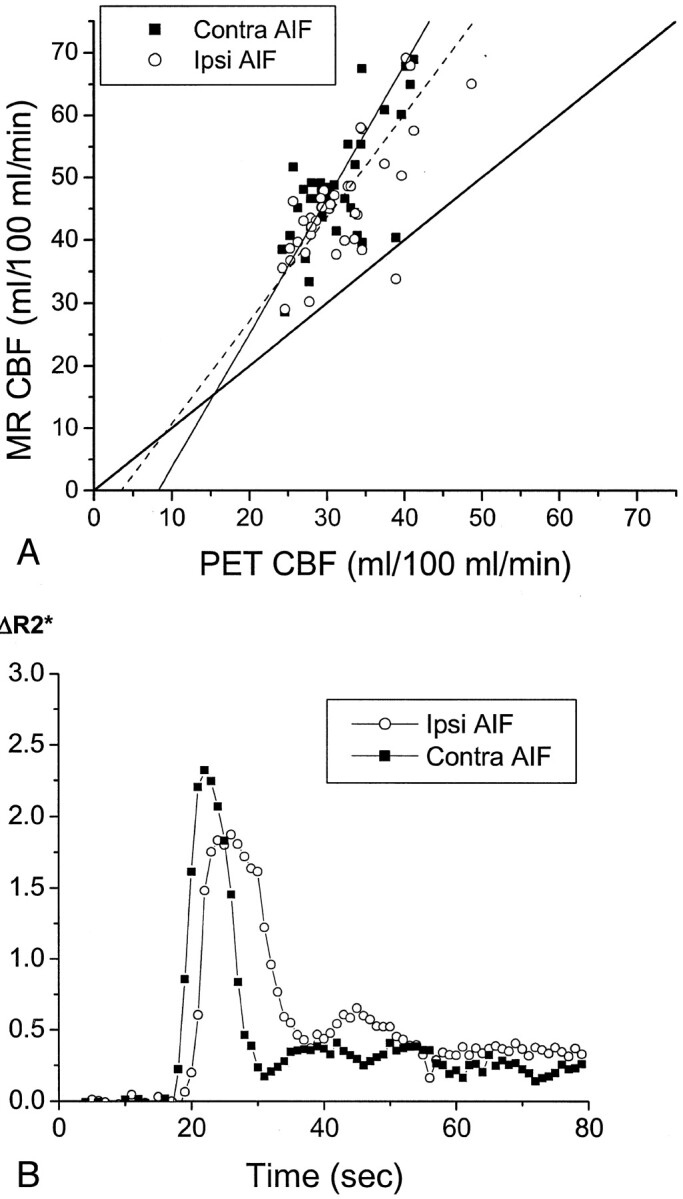
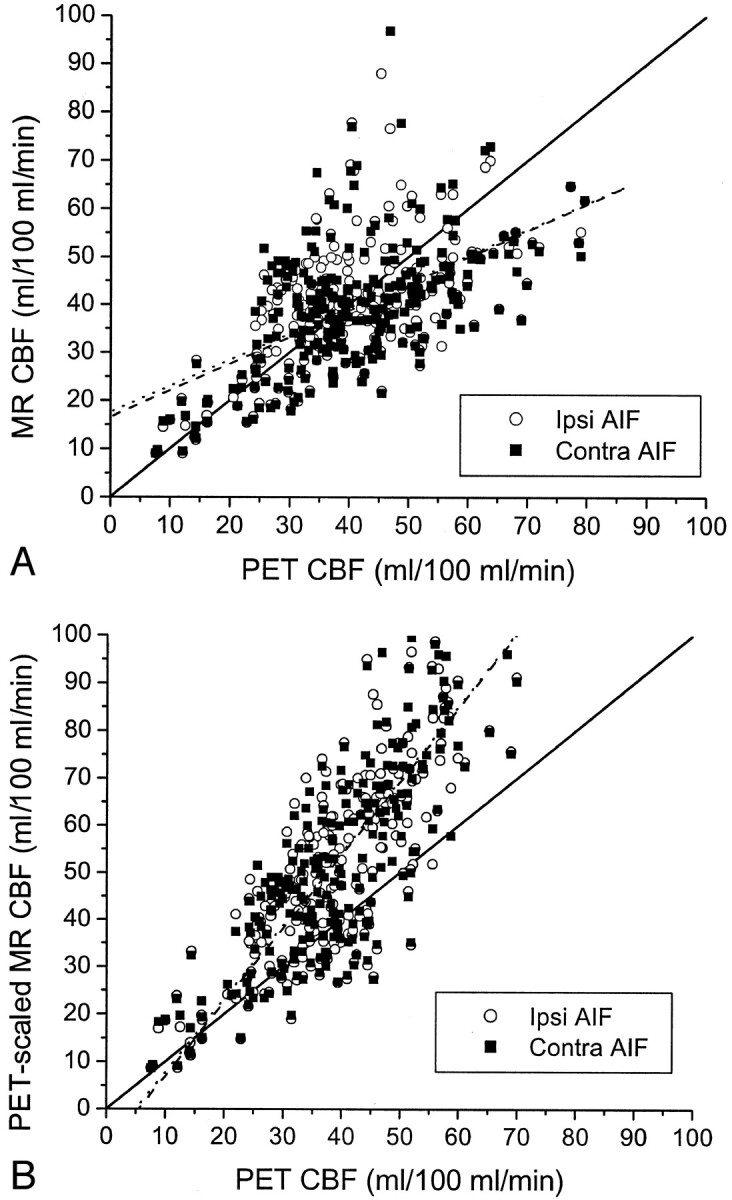
Results: Although CBF values measured by PET and MR imaging were positively correlated for every patient, the slopes and y intercepts of the regression lines varied widely among patients. The correlation was better when individual white matter CBF values measured by PET were used to scale the white matter CBF values measured by MR imaging (r = 0.84, P <.0001) than when constant contralateral CBF values were assumed (r = 0.54, P <.0001). The choice of AIF ipsilateral or contralateral to the occluded carotid artery made no statistically significant difference (P >.05) to the correlation coefficient, slope, or y intercept of the MR imaging versus PET CBF regressions for six of the seven patients.

Conclusion: Although linearly correlated with CBF values measured by PET, dynamic susceptibility contrast-enhanced MR imaging was not accurate for measuring absolute CBF values. AIF selection relative to the side of carotid occlusion did not significantly affect calculated MR imaging CBF values for six of the seven patients.


Figures

F<sc>ig</sc> 1.
Fig 1.
T2*-weighted gradient-echo single shot echo-planar transverse image (800/47; flip angle, 60 degrees), obtained at the level of the sylvian fissures in patient 7 (Table 1), who had left carotid occlusion, shows AIF selection at the M1 and M2 segments of the MCA. Pixels chosen for AIF determination are illustrated in yellow. Ten to 12 pixels were chosen in the MCA, both for an AIF ipsilateral to the occlusion and an AIF contralateral to the occlusion.
F<sc>ig</sc> 2.
Fig 2.
CBF in patient 4 (Table 1), who had occlusion of the left internal carotid artery. A, CBF measured with dynamic susceptibility contrast-enhanced MR imaging (MR CBF, left) and CBF measured with [15O]-H2O PET (PET CBR, right). Axial view MR image and PET scan are co-registered to the same location, filtered to the same spatial resolution as the PET scan, and displayed with the same color scale. Diffusely decreased CBF in the left hemisphere, ipsilateral to the occluded carotid artery, can be identified on both the MR image and PET scan, with more severely reduced CBF focally within a chronic infarct in the left frontal lobe. B, Large regions of interest (gray circles) for CBF measurement are shown on MR image obtained in the hemisphere contralateral to the carotid occlusion. Homologous regions of interest were placed in the hemisphere ipsilateral to the occlusion (see Methods). C, Small subcortical regions of interest (gray circles) in normal appearing white matter of the hemisphere contralateral to the carotid occlusion are shown on MR image. These subcortical white matter regions were used to determine normal white matter CBF for the purpose of scaling relative CBF values measured by MR imaging to physically meaningful units of mL/100 mL/min (see Methods).
F<sc>ig</sc> 3.
Fig 3.
CBF in patient 5, a 71-year-old man who had chronic right carotid occlusion. A, Graph compares CBF values measured by MR imaging (MR CBF) with those measured by PET (PET CBF). CBF values measured by PET have been corrected for the finite permeability of water through the blood-brain barrier (see Methods). CBF values measured by MR imaging were calculated with AIFs from the proximal MCA, both ipsilateral to the occluded carotid artery (Ipsi AIF, open circles) and contralateral to the occluded carotid artery (Contra AIF, closed squares). The line of identity, with a slope of 1 and a y intercept of 0, is depicted by a solid line. The slopes of the regression line for the data from the ipsilateral AIF (dashed line) and for the data from the contralateral AIF (dotted line) are both close to 1 (Table 2). No statistically significant difference was observed in the slopes or y intercepts of the two regression lines (P > .05). The linear relationship between CBF values measured by MR imaging and those measured by PET is statistically significant for both the ipsilateral AIF (r = 0.88, P < .0001) and the contralateral AIF (r = 0.88, P < .0001). CBF values measured by PET in the subcortical white matter regions used in scaling the CBF values measured by MR imaging was 21.1 mL/100 mL/min, which is close to the assumed value of 22 mL/100 mL/min (see Methods). B, Plots of the relaxivity ΔR2* versus time for the AIF in the M1 or M2 segment of the MCA ipsilateral to the carotid occlusion (open circles), and that contralateral to the occlusion (closed squares), show that they are almost identical. ΔR2* was determined as the negative log of susceptibility after baseline normalization. Because susceptibility is a relative measurement and not an absolute quantity, ΔR2* is expressed in arbitrary units. The amplitude of the observed change in ΔR2* is not quantitatively comparable between the ipsilateral and contralateral sides because of differences in factors such as vessel orientation and the extent of partial volume averaging of the blood vessel with surrounding tissue and/or CSF within the selected AIF pixels.
F<sc>ig</sc> 4.
Fig 4.
Delay and dispersal of the AIF ipsilateral to the occluded carotid artery affects calculated CBF values measured by MR imaging (MR CBF). Conventions used are as described in the legend to Figure 3. A, In a 65-year-old man with symptomatic left carotid occlusion (patient 7), CBF values measured by MR imaging systematically overestimated CBF values measured by PET (PET CBF). The linear regression between CBF values measured by MR imaging and those measured by PET has a slope of 1.65 for the ipsilateral AIF (Ipsi AIF, r = 0.79, P < .0001) and 2.14 for the contralateral AIF (Contra AIF, r = 0.81, P < .0001). This difference in slopes is statistically significant (P < .05). CBF value measured by PET in the subcortical white matter regions used in scaling the CBF values measured by MR imaging was 21.9 mL/100 mL/min, which is very close to the assumed value of 22 mL/100 mL/min. B, AIFs in patient 7 show a delay in the peak of the ipsilateral AIF (open circles) and a broader peak of the ipsilateral AIF, compared with the contralateral AIF (closed squares).
F<sc>ig</sc> 5.
Fig 5.
CBF in all seven patients. A, Pooled data from all seven patients shows a statistically significant correlation between CBF values measured by MR imaging (MR CBF) and CBF values measured by PET (PET CBF), when CBF values measured by MR imaging are calculated with an AIF ipsilateral to the carotid occlusion (Ipsi AIF, open circles) (r = 0.60, P < .0001) and with an AIF contralateral to the occlusion (Contra AIF, closed squares) (r = 0.54, P < .0001). No significant differences were observed between the correlation coefficients, slopes, or y intercepts of the regression lines for the ipsilateral AIF (dashed line) and the contralateral AIF (dotted line). Both regression lines have slopes significantly <1 (P < .001) and y intercepts significantly >0 (P < .001). Relative MR CBF values were scaled to absolute units by assuming a normal white matter flow rate of 22 mL/100 mL/min (see Methods). B, Use of white matter flow rates measured with PET for each patient to scale relative CBF values measured with MR imaging for each patient to absolute units improves the correlation between CBF values measured by MR imaging and those measured by PET, both for the ipsilateral AIF (open circles) (r = 0.85, P < .0001) and the contralateral AIF (closed squares) (r = 0.84, P < .0001). Again, no significant difference was observed between the correlation coefficients, slopes, or y intercepts of the regression lines for the ipsilateral AIF (dashed line) and the contralateral AIF (dotted line). However, both regression lines for PET-scaled CBF values measured by MR imaging versus CBF values measured by PET have slopes significantly >1 (P < .001) and y intercepts significantly <0 (P < .05).

References

    1. Sorensen AG, Copen WA, Ostergaard L, et al. Hyperacute stroke: simultaneous measurement of relative cerebral blood volume, relative cerebral blood flow, and mean tissue transit time. Radiology 1999;210:519–527 - PubMed
    1. Knopp EA, Cha S, Johnson G, et al. Glial neoplasms: dynamic contrast-enhanced T2*-weighted MR imaging. Radiology 1999;211:791–798 - PubMed
    1. Ernst TM, Chang L, Witt MD, et al. Cerebral toxoplasmosis and lymphoma in AIDS: perfusion MR imaging experience in 13 patients. Radiology 1998;208:663–669 - PubMed
    1. Rempp KA, Brix G, Wenz F, Becker CR, Guckel F, Lorenz WJ. Quantification of regional cerebral blood flow and volume with dynamic susceptibility contrast-enhanced MR imaging. Radiology 1994;193:637–641 - PubMed
    1. Ostergaard L, Weisskoff RM, Chesler DA, Gyldensted C, Rosen BR. High resolution measurement of cerebral blood flow using intravascular tracer bolus passages: part I. mathematical approach and statistical analysis. Magn Reson Med 1996;36:715–725 - PubMed

Publication types