. 2003 May 27;100(11):6364-9.
doi: 10.1073/pnas.1131966100. Epub 2003 May 15.

Genomewide demarcation of RNA polymerase II transcription units revealed by physical fractionation of chromatin

Affiliations

Genomewide demarcation of RNA polymerase II transcription units revealed by physical fractionation of chromatin

Peter L Nagy et al. Proc Natl Acad Sci U S A. .

Erratum in

  • Proc Natl Acad Sci U S A. 2006 Oct 10;103(41):15273

Abstract

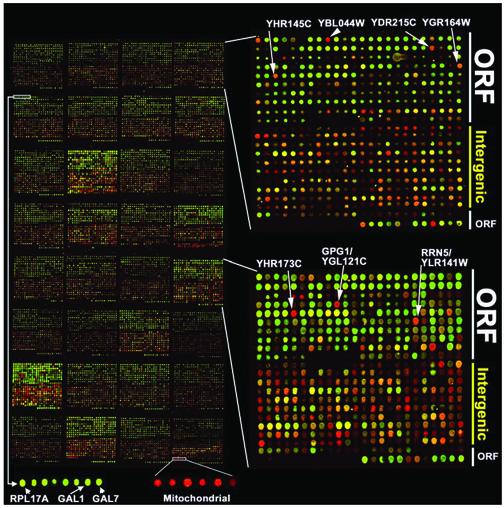
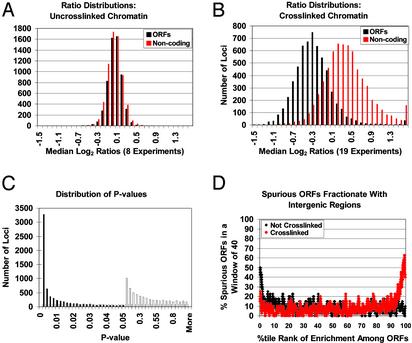
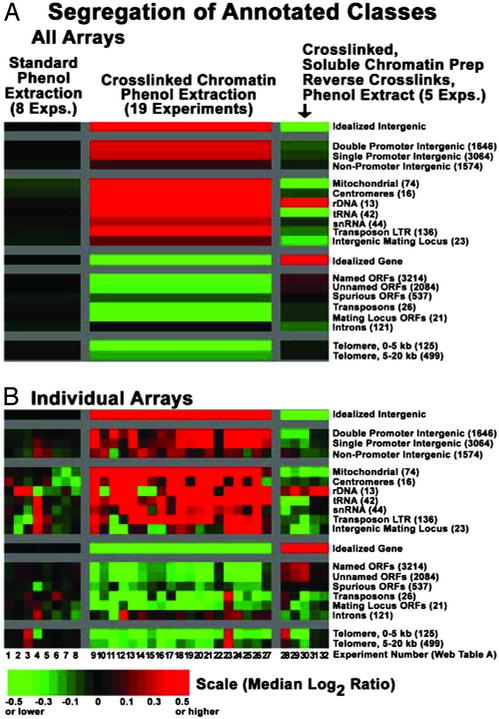
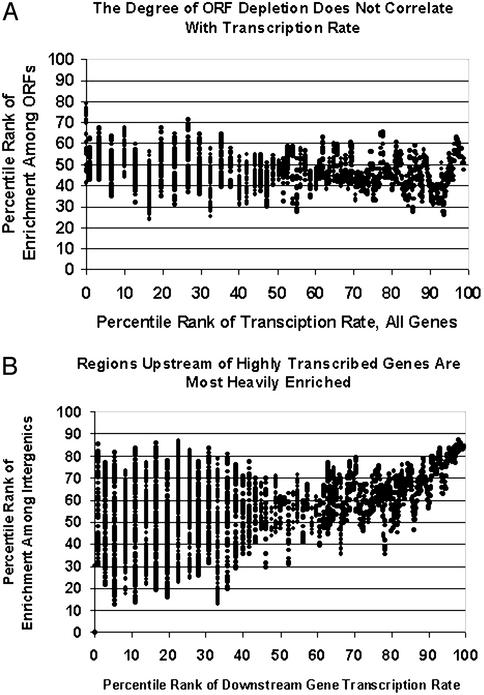
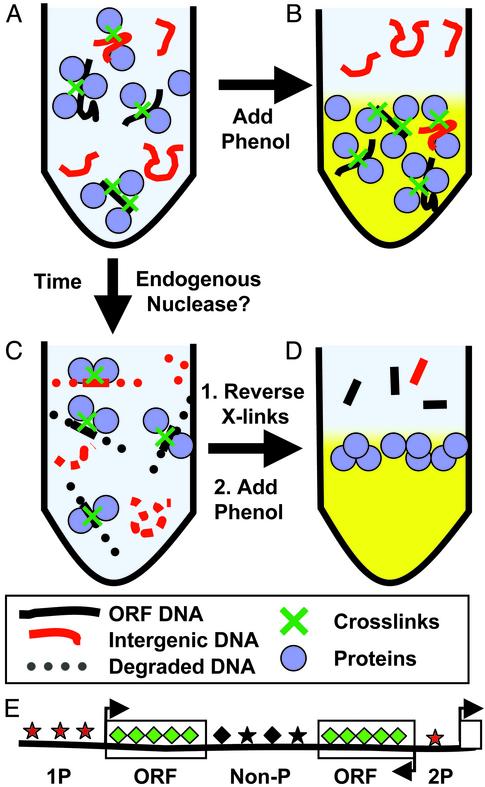
Epigenetic modifications of chromatin serve an important role in regulating the expression and accessibility of genomic DNA. We report here a genomewide approach for fractionating yeast chromatin into two functionally distinct parts, one containing RNA polymerase II transcribed sequences, and the other comprising noncoding sequences and genes transcribed by RNA polymerases I and III. Noncoding regions could be further fractionated into promoters and segments lacking promoters. The observed separations were apparently based on differential crosslinking efficiency of chromatin in different genomic regions. The results reveal a genomewide molecular mechanism for marking promoters and genomic regions that have a license to be transcribed by RNA polymerase II, a previously unrecognized level of genomic complexity that may exist in all eukaryotes. Our approach has broad potential use as a tool for genome annotation and for the characterization of global changes in chromatin structure that accompany different genetic, environmental, and disease states.


Figures

Fig. 1.
Fig. 1.
Separation and detection of functionally distinct genomic regions. In general, SGD-annotated ORFs are printed on the top half of each sector, and intergenic regions are printed on the bottom half. (Left) DNA remaining in the aqueous fraction after phenol extraction of crosslinked extract (red) was hybridized comparatively with DNA remaining in the aqueous fraction after phenol extraction of crosslinked solubilized chromatin whose crosslinks had been reversed before extraction (green). Therefore, both intergenic enrichment (red) and ORF enrichment (green) are being assayed simultaneously (Experiment 24, jdl_g_111E). To confirm the separable enrichment observed in each channel, each sample was analyzed independently relative to a standard DNA reference (Fig. 4, Experiments 20 and 29). (Right) An enlarged view of two sectors. Genomic fragments corresponding to YHR145C, YBL044W, YDR250C, YGR164W, and YHR173C segregated anomalously. All are short ORFs for which there is no evidence for transcription. However, there were exceptions: arrayed elements GPG1 and RRN5 detected anomalous fractionation of confirmed protein-coding genes. (Lower) Despite differences in expression level during log-phase growth in dextrose (32), RPL17A, GAL1, and GAL7 segregated similarly in both enrichment procedures. Mitochondrial DNA, which is nucleosome-free, was the most heavily enriched class of DNA in the crosslinked-chromatin phenol extraction procedure.
Fig. 2.
Fig. 2.
ORFs and intergenic regions can be fractionated, but spurious ORFs do not segregate with functional ORFs. (A) Conventional phenol-chloroform extraction and DNA amplification yield unbiased DNA populations. A histogram of the distribution of normalized median log2 ratio values across eight control experiments (Experiments 1–8; see table A, https://genome.unc.edu/pubsup/chromatin2003) for SGD-annotated ORFs (black) or noncoding regions (red). All arrayed elements were plotted. (B) Phenol-chloroform extraction of crosslinked chromatin differentially segregates coding and noncoding regions. A histogram of the distribution of ratio medians [log2(experimental signal intensity/normalized reference signal intensity)] across 19 experiments (Experiments 9–27, table A, https://genome.unc.edu/pubsup/chromatin2003). Each DNA sample was prepared independently by phenol-chloroform extraction from crosslinked yeast, whereas reference DNA was prepared independently from noncrosslinked yeast (Experiments 9–22, for treatment in Experiments 23–27; see table A, https://genome.unc.edu/pubsup/chromatin2003). All arrayed elements were plotted: SGD-annotated ORFs (black); noncoding regions (red). (C) The differential segregation of individual genomic fragments using crosslinked vs. noncrosslinked chromatin. The distribution of P values resulting from a comparison of the ratios [log2(experimental signal intensity/normalized reference signal intensity)] at individual spots in 19 crosslinked/uncrosslinked (Experiments 9–27) and eight uncrosslinked/uncrosslinked samples (Experiments 1–8). Each bar represents the number of occurrences in increments or “bin size” of 0.002 for values between 0 and 0.05 is (filled bars), and in increments of 0.05 for values between 0.05 and 1 (open bars). (D) Annotated ORFs were ordered according to the percentile rank of their enrichment in crosslinked samples subjected to phenol/chloroform extraction, such that those to the right behave most like intergenic sequences. Plotted is the percentage of ORFs at each rank (moving window = 40, step size 1) that were classified as “Spurious” or “Very Hypothetical” (19). Many of the ORF sequences recovered from the aqueous phase are likely to be misannotated.
Fig. 4.
Fig. 4.
Genomewide fractionation of functionally distinct genomic regions. Arrayed DNA elements were divided into functional groups based on their classification in Stanford Microarray Database, or in the case of “Spurious ORFs” as classified by Wood et al. (19) (labeled on the right). All categories are mutually exclusive, except for the telomeric classes, which contain spots that also appear in other categories. (see supplemental results at https://genome.unc.edu/pubsup/chromatin2003) The number of arrayed elements in each functional category is listed in parentheses on the right. Experiment numbers (bottom) refer to table A, https://genome.unc.edu/pubsup/chromatin2003. Experiments 1–8 compared standard genomic DNA preparations with genomic DNA preparations from (i) extracts that had not been crosslinked, (ii) extracts that had been crosslinked, followed by reversal of crosslinks, and (iii) extracts that had been crosslinked after phenol extraction. Experiments 9–22 revealed the intergenic enrichment phenomenon described in Results. In Experiments 23–27, the reference was intergenic-enriched, and the samples were ORF enriched, so the cumulative effect was measured. Experiments 28–32 revealed the ORF enrichment. See Materials and Methods for details of array design. (A) Colors (see scale) represent the median of all ratio values for all arrayed elements in each functional class (labeled on the right, top to bottom) within each of the three experimental categories (labeled at the top, left to right). (B) To illustrate reproducibility, medians for individual arrays, rather than across experimental categories, are shown.
Fig. 3.
Fig. 3.
The fractionation does not depend on active transcription. (A) The moving median (window size = 40) of percentile rank of enrichment among ORFs in 19 crosslinked-chromatin phenol extraction experiments (Experiments 9–27) is plotted against percentile rank of transcription rate (mRNAs/hr) (32). Under the tested growth conditions, there is no correlation between transcription rate and the degree of ORF depletion. See also the GAL genes in Fig. 1. Intron-containing genes are not included (see supplemental results at https://genome.unc.edu/pubsup/chromatin2003, for justification). (B) Intergenic regions upstream of heavily transcribed genes are more heavily enriched. Compare with A. A moving median (window = 40) of the percentile rank of enrichment among upstream intergenic regions reported in 19 crosslinked-chromatin phenol extraction experiments (Experiments 9–27) plotted against the percentile rank of the transcription rate of the downstream gene. If two genes are downstream, the highest rate is used. All upstream intergenic spots were analyzed, regardless of P value. The graph for data derived from intergenic regions upstream of only one gene is essentially identical (figure B at https://genome.unc.edu/pubsup/chromatin2003), showing that the observation was not created by including double promoters, which as a class are more heavily enriched than single promoters (Fig. 4) or by plotting only the most highly transcribed of two downstream genes.
Fig. 5.
Fig. 5.
Proposed mechanism for chromatin fractionation. A–D are described in Discussion. (E) Genomic regions upstream of two genes (2P) were most strongly enriched in the aqueous phase during the process depicted in A and B, whereas genomic regions upstream of one gene (1P) were less strongly enriched. Intergenic regions that do not contain promoters (Non-P) were neither enriched nor depleted, whereas DNA encoding ORFs was strongly depleted. The shape and spacing of the symbols associated with each genomic region represent differences in histone modification or nucleosome distribution, respectively, that may underlie the differential fractionation.

References

    1. Richards, E. J. & Elgin, S. C. (2002) Cell 108, 489–500. - PubMed
    1. Jacobs, S. A., Taverna, S. D., Zhang, Y., Briggs, S. D., Li, J., Eissenberg, J. C., Allis, C. D. & Khorasanizadeh, S. (2001) EMBO J. 20, 5232–5241. - PMC - PubMed
    1. Nielsen, S. J., Schneider, R., Bauer, U. M., Bannister, A. J., Morrison, A., O'Carroll, D., Firestein, R., Cleary, M., Jenuwein, T., Herrera, R. E. & Kouzarides, T. (2001) Nature 412, 561–565. - PubMed
    1. van Leeuwen, F. & Gottschling, D. E. (2002) Curr. Opin. Cell Biol. 14, 756–762. - PubMed
    1. Lieb, J. D., Liu, X., Botstein, D. & Brown, P. O. (2001) Nat. Genet. 28, 327–334. - PubMed

Publication types

Associated data