

Modeling the training-performance relationship using a mixed model in elite swimmers
- PMID: 12750595
- PMCID: PMC4764670
- DOI: 10.1249/01.MSS.0000065004.05033.42
Modeling the training-performance relationship using a mixed model in elite swimmers
Abstract
Purpose: The aim of this study was to model the relationship between training and performance in 13 competitive swimmers, over three seasons, and to identify individual and group responses to training.
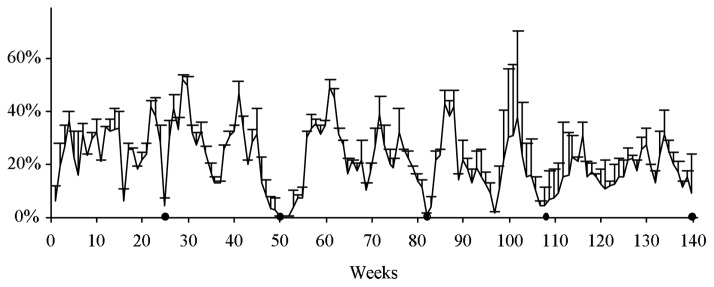
Methods: A linear mixed model was used as an alternative to the Banister model. Training effect on performance was studied over three training periods: short-term, the average of training load accomplished during the 2 wk preceding each performance of the studied period; mid-term, the average of training load accomplished during weeks 3, 4, and 5 before each performance; and long-term, weeks 6, 7, and 8.
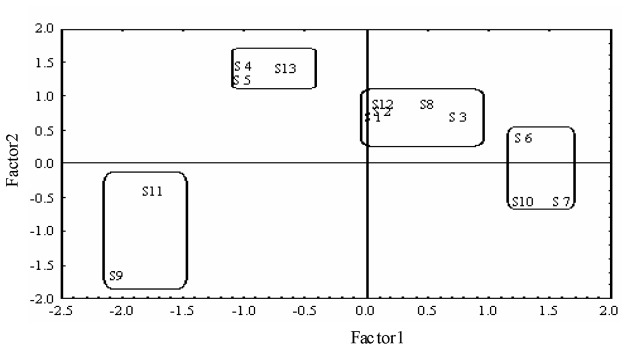
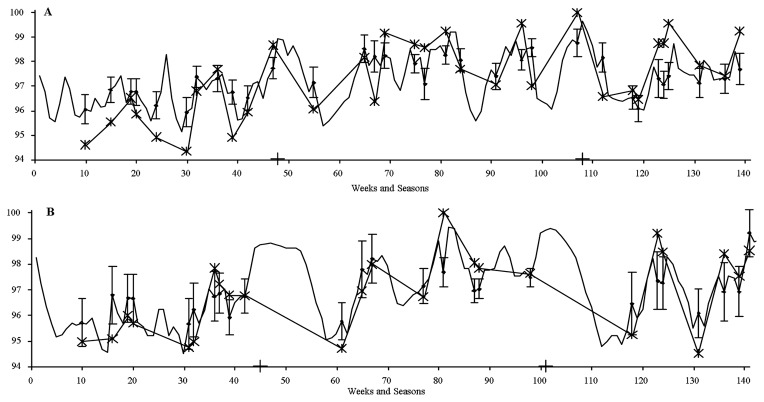
Results: Cluster analysis identified four groups of subjects according to their reactions to training. The first group corresponded to the subjects who responded well to the long-term training period, the second group to the long- and mid-term periods, the third to the short- and mid-term periods, and the fourth to the combined periods. In the model, the intersubject differences and the evolution over the three seasons were statistically significant for the identified groups of swimmers. Influence of short-term training was negative on performance in the four groups, whereas mid- and long-term training had, on the average, a positive effect in three groups out of four. Between seasons 1 and 3, the effect of mid-term training declined, whereas the effect of long-term training increased. The fit between real and modeled performances was significant for all swimmers (0.15 </= r2 </= 0.65; P </= 0.01).
Conclusion: The mixed model described a significant relationship between training and performance both for individuals and for groups of swimmers. This relationship was different over the 3 yr. Personalized training schedules could be prescribed on the basis of the model results.
Figures
References
-
- Ali MA. Effect of sample size on the size of the coefficient of determination in simple linear regression. J Inform Optim Sci. 1987;8(2):209–219.
-
- Banister EW, Calvert TW, Savage MV. A systems model of training for athletic performance. Can J Sports Med. 1975;7:57–61.
-
- Banister EW, Fitz-Clarke JR. Plasticity of response to equal quantities of endurance training separated by non-training in humans. J Therm Bio. 1993;18:587–597.
-
- Banister EW, Carter JB, Zarcadas PC. Training theory and taper: validation in triathlon athletes. Eur J Appl Physiol Occup Physiol. 1999;79:182–191. - PubMed
-
- Busso T, Carasso C, Lacour JR. Adequacy of a systems structure in the modeling of training effects on performance. Am Physiol Soc. 1991;61:48–52. - PubMed
Publication types
MeSH terms
LinkOut - more resources
Full Text Sources
