Comparative Study
. 2003 Jun;185(11):3392-9.
doi: 10.1128/JB.185.11.3392-3399.2003.

Modeling bacterial evolution with comparative-genome-based marker systems: application to Mycobacterium tuberculosis evolution and pathogenesis

Affiliations
Comparative Study

Modeling bacterial evolution with comparative-genome-based marker systems: application to Mycobacterium tuberculosis evolution and pathogenesis

David Alland et al. J Bacteriol. 2003 Jun.

Abstract

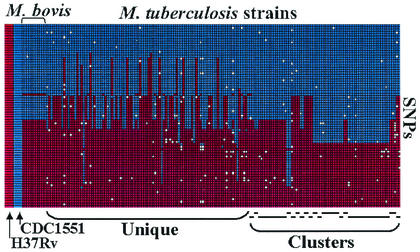
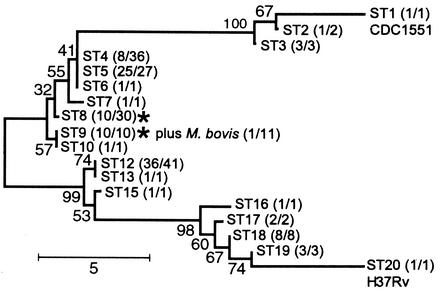
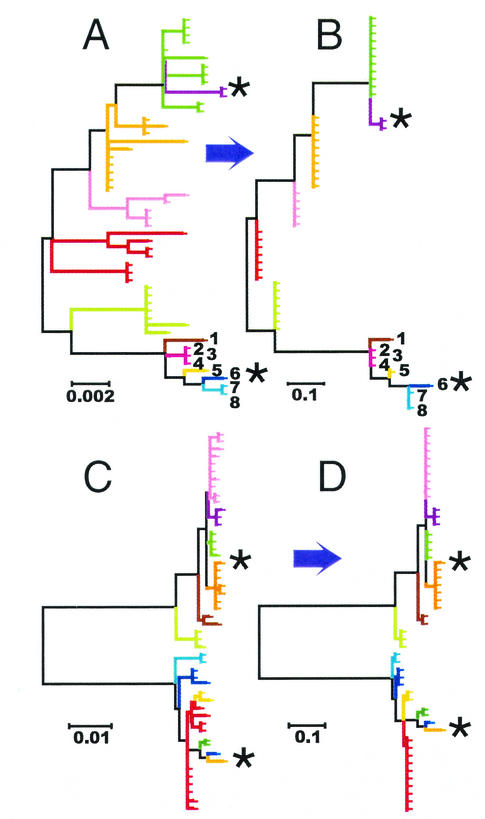
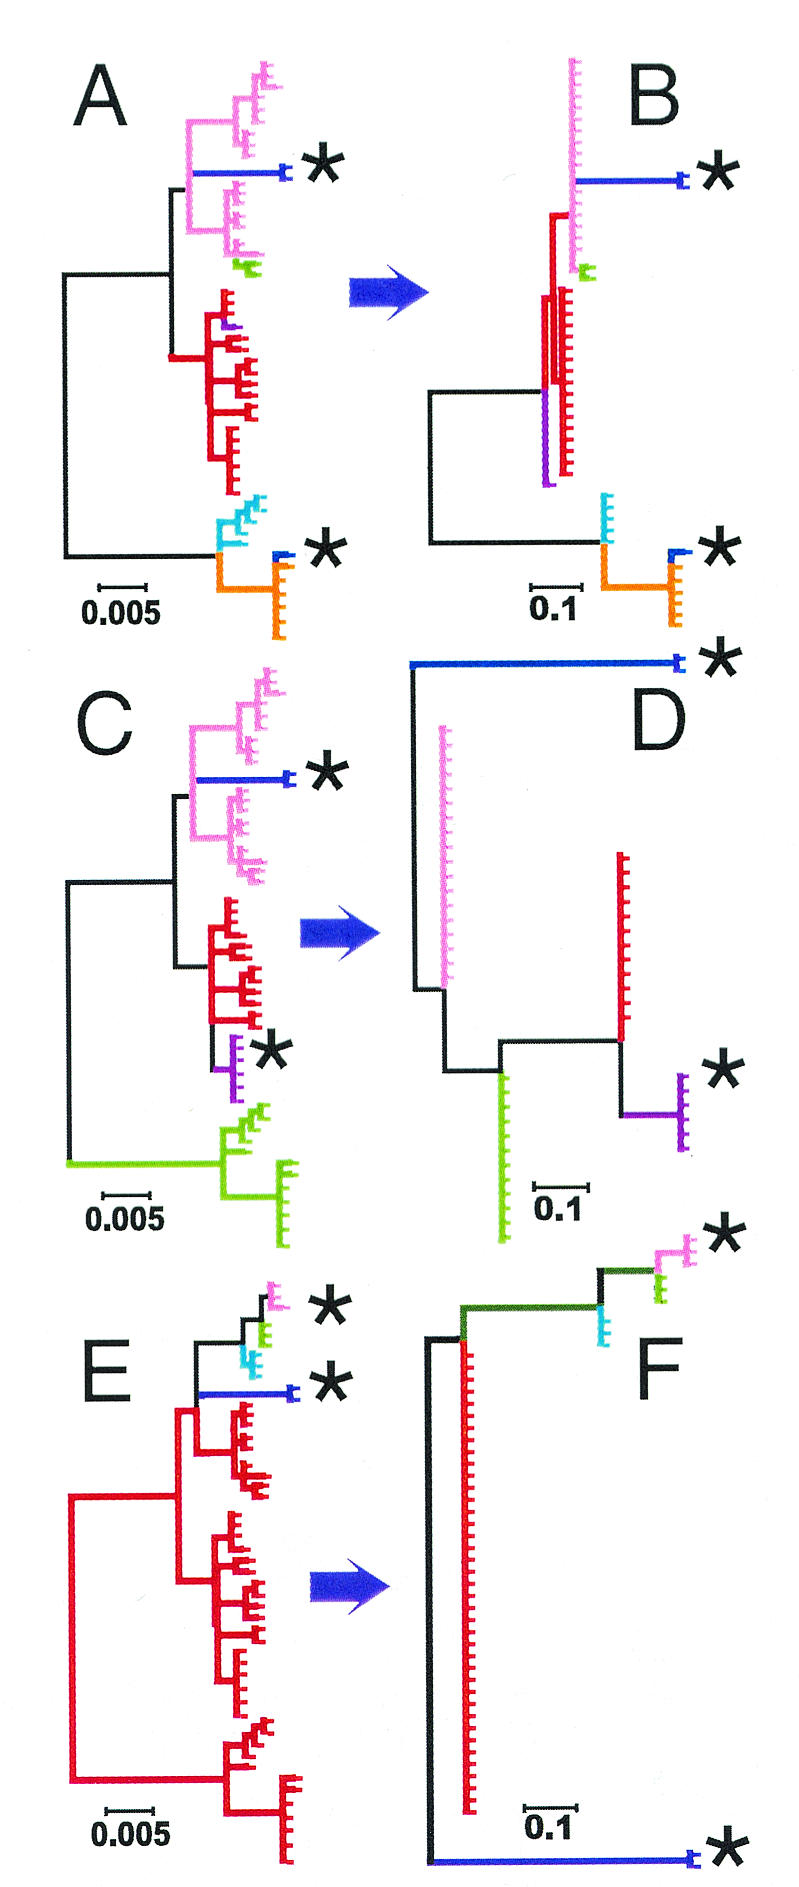
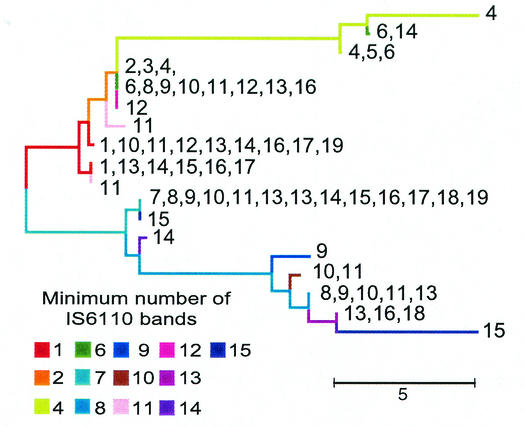
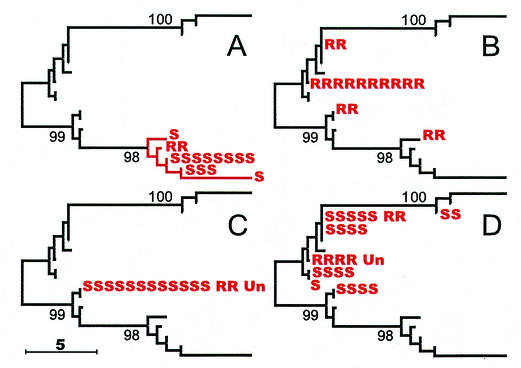
The comparative-genomic sequencing of two Mycobacterium tuberculosis strains enabled us to identify single nucleotide polymorphism (SNP) markers for studies of evolution, pathogenesis, and epidemiology in clinical M. tuberculosis. Phylogenetic analysis using these "comparative-genome markers" (CGMs) produced a highly unusual phylogeny with a complete absence of secondary branches. To investigate CGM-based phylogenies, we devised computer models to simulate sequence evolution and calculate new phylogenies based on an SNP format. We found that CGMs represent a distinct class of phylogenetic markers that depend critically on the genetic distances between compared "reference strains." Properly distanced reference strains generate CGMs that accurately depict evolutionary relationships, distorted only by branch collapse. Improperly distanced reference strains generate CGMs that distort and reroot outgroups. Applying this understanding to the CGM-based phylogeny of M. tuberculosis, we found evidence to suggest that this species is highly clonal without detectable lateral gene exchange. We noted indications of evolutionary bottlenecks, including one at the level of the PHRI "C" strain previously associated with particular virulence characteristics. Our evidence also suggests that loss of IS6110 to fewer than seven elements per genome is uncommon. Finally, we present population-based evidence that KasA, an important component of mycolic acid biosynthesis, develops G312S polymorphisms under selective pressure.


Figures

FIG. 1.
FIG. 1.
Distribution of M. tuberculosis H37Rv-CDC1551 SNPs in the M. tuberculosis and M. bovis isolates. Each SNP allele is indicated by the box color at the intersection of the horizontal (SNP) axis and the vertical (M. tuberculosis or M. bovis) axis: blue, CDC1551 allele; red, H37Rv allele; and white, failed SNP detection reaction. Clusters of isolates that have the same IS6110-based RFLP pattern are identified at the bottom of the figure by horizontal lines; isolates with unique RFLP patterns are identified next to the clustered isolates as “unique.” For reference, the alleles of the CDC1551 and H37Rv strains are also shown (left, boxes magnified).
FIG. 2.
FIG. 2.
Minimum evolution tree of the M. tuberculosis and M. bovis isolates with the use of CGM SNPs. One example of the bootstrapped tree is shown. Bootstrap values are indicated at each branch point. The STs discussed in the text are located after each branch, followed by numbers in parentheses indicating number of RFLP patterns (an approximation for strains) in each ST/number of isolates in each ST. Distance = number of SNP differences. *, locations of one RFLP-defined strain that is indicated twice because isolates with this RFLP pattern occurred on two neighboring STs.
FIG. 3.
FIG. 3.
Evolution simulations. (A and C) Two examples of “true” simulated evolutionary trees. (B and D) Recreations of the “true” evolutionary simulations in panels A and C with the use of CGMs. Each tick mark indicates one simulated “strain.” Reference strains for the CGMs are indicated by asterisks. Colored branches in panels A and B highlight sections of the trees that are collapsed into single branches in the corresponding CGM trees (B and D, respectively). Numbered strains 1 to 8 indicate strains discussed in the text.
FIG. 4.
FIG. 4.
Effect of decreasing pairwise distances between reference strains on CGM SNP trees. (A, C, and E) True evolutionary simulations: identical “true” simulated evolutionary trees, differing only in the colored branches that are collapsed into single branches in the corresponding “CGM” trees B, D, and F. (B) Optimal reference strains: a CGM tree of panel A, constructed with sequence differences derived from an optimal pair of reference strains (situated at maximal pairwise genetic distance from each other). (D and F) Suboptimal reference strains: CGM trees of panel A, constructed with a pair of reference strains that have either moderate pairwise distance (D) or poor pairwise distance (F). Each tick mark indicates one simulated “strain.” Reference strains for the CGMs are indicated by an asterisk.
FIG. 5.
FIG. 5.
Distribution of IS6110 elements in isolates on the CGM M. tuberculosis tree. Colored branches correspond to the minimum number of IS6110 elements for any isolate within the branch. Numbers indicate the distribution of IS6110 elements within members of that branch.
FIG. 6.
FIG. 6.
Distribution of new polymorphisms on the CGM M. tuberculosis tree. The locations of each isolate with a specific polymorphism are shown on the M. tuberculosis tree. (A) Isolates with the gyrA S95T polymorphism; (B) isolates with the katG S315T polymorphism; (C) isolates with the kasA G269S polymorphism; (D) isolates with the kasA G312S polymorphism. In panel A all isolates on the indicated branches contained the mutant allele; in panels B, C, and D, not all isolates on the indicated branches contained the mutant allele. Each isolate with the polymorphism is designated as follows: R, isoniazid resistant; S, isoniazid susceptible; or Un, unknown susceptibility.

References

    1. Alland, D., G. E. Kalkut, A. R. Moss, R. A. McAdam, J. A. Hahn, W. Bosworth, E. Drucker, and B. R. Bloom. 1994. Transmission of tuberculosis in New York City. An analysis by DNA fingerprinting and conventional epidemiologic methods. N. Engl. J. Med. 330:1710-1716. - PubMed
    1. Brosch, R., S. V. Gordon, M. Marmiesse, P. Brodin, C. Buchrieser, K. Eiglmeier, T. Garnier, C. Gutierrez, G. G. Hewinson, K. Kremer, L. M. Parsons, A. S. Pym, S. Samper, D. van Soolingen, and S. T. Cole. 2002. A new evolutionary scenario for the Mycobacterium tuberculosis complex. Proc. Natl. Acad. Sci. USA 99:3684-3689. - PMC - PubMed
    1. Cole, S. T., R. Brosch, J. Parkhill, T. Garnier, C. Churcher, D. Harris, S. V. Gordon, L. Eiglmeier, S. Gas, C. E. Barry III, F. Tekaia, K. Badcock, D. Basham, D. Brown, T. Chillingworth, R. Connor, R. Davies, K. Devlin, T. Feltwell, S. Gentles, N. Hamlin, S. Holroyd, T. Hornsby, K. Jagels, A. Krogh, J. Mclean, S. Moule, L. Murphy, K. Oliver, J. Osborne, M. A. Quai, M. A. Rajandream, J. Rogers, S. Rutter, K. Seeger, J. Skelton, R. Squares, S. Squares, J. E. Sulston, K. Taylor, S. Whitehead, and B. G. Barrell. 1998. Deciphering the biology of Mycobacterium tuberculosis from the complete genome sequence. Nature 393:537-544. - PubMed
    1. Cummings, C. A., and D. A. Relman. 2002. Genomics and microbiology. Microbial forensics—“cross-examining pathogens.” Science 296:1976-1979. - PubMed
    1. Fang, Z., C. Doig, D. T. Kenna, N. Smittipat, P. Palittapongarnpim, B. Watt, and K. J. Forbes. 1999. IS6110-mediated deletions of wild-type chromosomes of Mycobacterium tuberculosis. J. Bacteriol. 181:1014-1020. - PMC - PubMed

Publication types

Substances

LinkOut - more resources