. 2003 Jul 15;550(Pt 2):419-29.
doi: 10.1113/jphysiol.2003.040113. Epub 2003 May 16.

Aquaporin-1 and HCO3(-)-Cl- transporter-mediated transport of CO2 across the human erythrocyte membrane

Affiliations

Aquaporin-1 and HCO3(-)-Cl- transporter-mediated transport of CO2 across the human erythrocyte membrane

Michael E Blank et al. J Physiol. .

Abstract

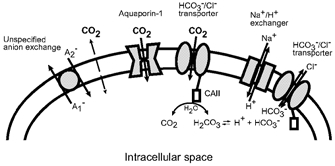
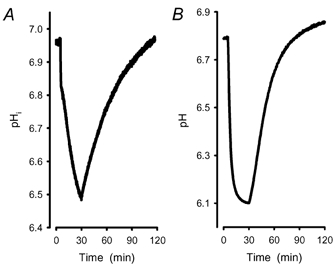
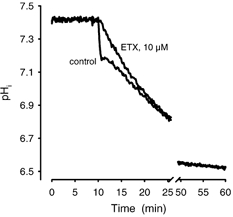
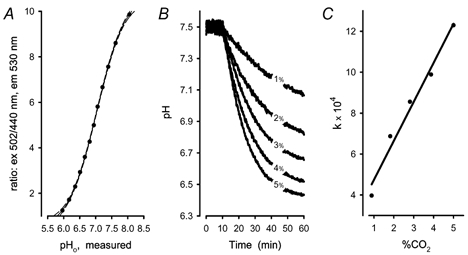
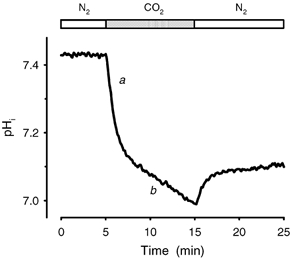
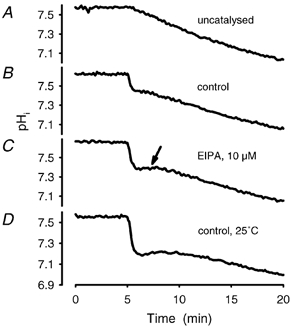
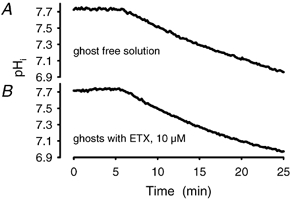
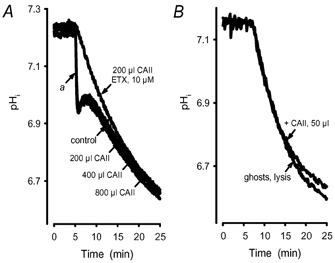
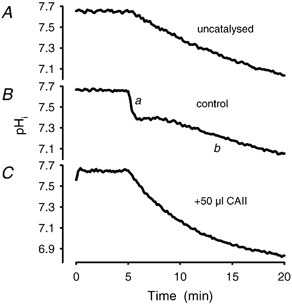
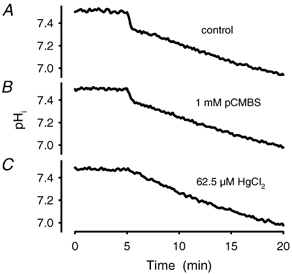
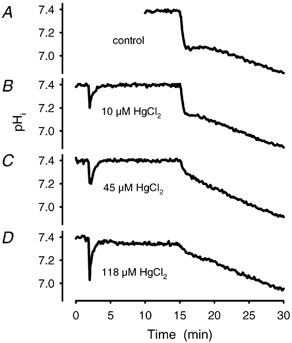
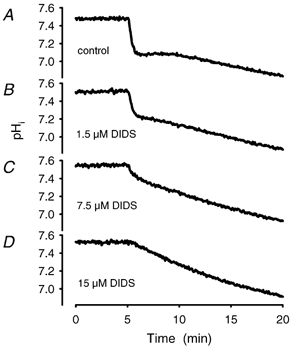
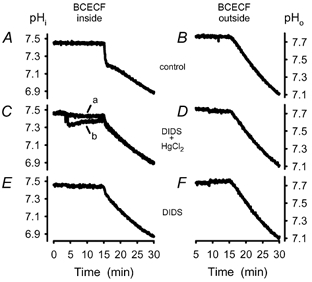
Recent studies have suggested that aquaporin-1 (AQP1) as well as the HCO3(-)-Cl- transporter may be involved in CO2 transport across biological membranes, but the physiological importance of this route of gas transport remained unknown. We studied CO2 transport in human red blood cell ghosts at physiological temperatures (37 degrees C). Replacement of inert with CO2-containing gas above a stirred cell suspension caused an outside-to-inside directed CO2 gradient and generated a rapid biphasic intracellular acidification. The gradient of the acidifying gas was kept small to favour high affinity entry of CO2 passing the membrane. All rates of acidification except that of the approach to physicochemical equilibrium of the uncatalysed reaction were restricted to the intracellular environment. Inhibition of carbonic anhydrase (CA) demonstrated that CO2-induced acidification required the catalytic activity of CA. Blockade of the function of either AQP1 (by HgCl2 at 65 microM) or the HCO3(-)-Cl- transporter (by DIDS at 15 microM) completely prevented fast acidification. These data indicate that, at low chemical gradients for CO2, nearly the entire CO2 transport across the red cell membrane is mediated by AQP1 and the HCO3--Cl- transporter. Therefore, these proteins may function as high affinity sites for CO2 transport across the erythrocyte membrane.


Figures

Figure 1
Figure 1. Schematic diagram illustrating possible routes of CO2 entry into the human erythrocyte and secondary transport processes
CO2 may enter the erythrocyte either by directly diffusing through the lipid bilayer or by passing through membrane proteins (aquaporin-1, HCO3–Cl transporter) which would function as gas channels. Once CO2 has entered the erythrocyte, it will be hydrated by CAII bound to the carboxyl terminus of the HCO3–Cl transporter. Intracellular carbonic acid then dissociates into a proton and bicarbonate. Both reaction products can be eliminated from the intracellular space by specific transporters, the Na+-H+ exchanger and the HCO3–Cl transporter. These processes will further increase the entry of CO2 and therefore intracellular acidification. Net proton fluxes may also be linked to anion exchange activity (unspecified anion exchange with substrates A1 and A2).
Figure 2
Figure 2. Asymmetry of acidification and pHi recovery
A, intracellular acidification in ghosts under exposure to carbogen. After 30 min, carbogen was replaced by N2. The initial pHi was regained after ∼90 min gassing with N2. The rate of acidification is greater than the rate of pHi recovery. B, recording of an acidification of ghost free buffer (10 mM Tris, pH 6.8). At this pH there is no buffer capacity left in a Tris–HCl buffer system. Therefore the steady state was reached after ∼30 min and pH is down to 6.1. Replacement of CO2 with N2 also showed an asymmetric pH recovery.
Figure 3
Figure 3. Steady state of pHi after prolonged exposure to CO2
Gassing a ghost suspension in PBS with carbogen (control) showed an initial fast acidification and then a slow approach to the physicochemical equilibrium, which was reached after ∼60 min. Addition of ETX (10 μM) to the ghost suspension blocked the initial fast component. The physicochemical equilibrium was not affected by the addition of ETX.
Figure 4
Figure 4. BCECF calibration curve and dependency of acidification rates on the concentration of CO2
A, BCECF calibration curve measured in a ghost suspension at 1 μM nigericin in 10 mM phosphate buffered potassium chloride (154 mM, 300 mosmol kg−1, pH 7.4 ± 0.15). Data were fitted to a sigmoidal mechanism (y = a + b/(1+e(-(x - c)/d))), with r2 > 0.999. Filled circles: pHo, measured; continuous line: fit results; dashed lines: 95 % confidence. B, recordings of acidification in ghost free buffer with ∼1, 2, 3, 4 and 5 % CO2 in the feeding gas. Values corrected for density differences were 0.884, 1.82, 2.81, 3.87, and 5 % CO2, respectively. C, rates of acidification were obtained by fitting the recordings of acidification (B) to a mono exponential mechanism. Filled circles: calculated velocity constants (k) of a mono-exponential fit; continuous line: linear regression curve (r2 > 0.975).
Figure 5
Figure 5. General protocol of an intracellular acidification of a ghost suspension under exposure to CO2
Acidification was measured with the fluorescent dye BCECF. Excitation wavelengths were set to 502 and 440 nm, emission to 530 nm. The samples (1.5 ml) were incubated in fluorescence cells for 10 min, at 37 °C. Gas flow through a stopper was 2.5 l h−1. The suspension was stirred at 950 r.p.m. First, inert gas (N2) was used (open bars); then after an appropriate time (here 5 min), gas supply was switched to acidifying gas (carbogen, grey bar). If necessary the cycle was repeated. The graph can be fitted by several mono-exponential functions. a denotes the fast process of acidification, b the slow approach to physicochemical equilibrium.
Figure 6
Figure 6. Influence of the proton net back flux capacity on the extent of the fast acidification process
Comparison of the uncatalysed acidification (A) with a control assay (B) and experiments with retarded back flux (C and D). The samples were incubated under conditions as described in Fig. 5. A, a typical uncatalysed reaction. An uncatalysed reaction is achieved either by adding ETX (10 μM) to the ghost suspension or by gassing PBS to which BCECF (free acid) had been added (see Fig. 7A and B). B, a control experiment, which is the time course of acidification according to the standard protocol. C, a retarded back flux under conditions that inhibit the Na+-H+ antiporter (10 μM EIPA, incubated for 30 min prior to acidification). The arrow indicates the more pronounced plateau phase (kinetic data of acidification using a mono-exponential fit, see Table 1). D demonstrates that a temperature-sensitive transport mechanism is involved in the back flux of acidic equivalents. The temperature was lowered to 25 °C and caused a significant drop in acidification after the onset of CO2, since the elimination of acidic equivalents is retarded (kinetic data of acidification using a mono-exponential fit, see Table 1).
Figure 7
Figure 7. Gassing of ghost-free buffer and gassing CAII-blocked ghost suspensions reveal identical time courses
Approach to the physicochemical equilibrium: comparison of the time course of acidification of uncatalysed reactions. A, time course of a ghost-free buffer (PBS: 10 mM, 300 mosmol kg−1, pH: 7.4) solution to which BCECF (free acid) has been added. B, typical time course of acidification with blocked CAII activity through addition of the membrane-permeant ETX (10 μM). The time constants of both assays were not statistically different.
Figure 8
Figure 8. CAII activity in a ghost preparation is not rate limiting under experimental conditions
A, under the condition of resealing, ghosts were incubated with different amounts of human CAII (0, 200, 400 and 800 μl of 2.5 mg ml−1 CAII). a denotes the fast acidification for the four assays. The statistical error of the initial rates is < 5 %, i.e. CAII load of a ghost preparation does not increase the rate or the ΔpHi of the fast acidification. B, the rate of acidification after addition of CAII (50 μl) to a ghost suspension was very similar to the rate of acidification calculated for ghosts that had undergone lysis by a 1:6 dilution into hyposmotic (20 mosmol kg−1) PBS.
Figure 9
Figure 9. Intracellular CAII is required for fast and biphasic acidification
Addition of CAII (50 μl of 2.0 mg ml−1 human CAII) to the extracellular compartment of a ghost suspension (C) yields higher rates than the uncatalysed approach to the physicochemical equilibrium (A) (by addition of 10 μM ETX to the ghost suspension). No difference from Fig. 6A and Fig. 7B regarding the velocity constants could be detected. B, a control experiment with a fast (a) and a slow (b) acidification response.
Figure 10
Figure 10. Comparison of the effect of the AQP1 blocker pCMBS and HgCl2
A, a control experiment. B, the sample has been incubated for 15 min with pCMBS at a final concentration of 1 mM. The change of pH in the fast phase is less and the time constant of that process is smaller compared to control. C represents the time course of an acidifying process measured in ghosts with HgCl2 at a concentration of 62.5 μM. After onset of CO2 the time course is not distinguishable from an uncatalysed reaction.
Figure 11
Figure 11. Establishment of a dose–response curve for the AQP1 inhibitor HgCl2
A dose–response curve has been derived from acidification experiments in the presence of various concentrations of HgCl2. Incubation time was 13 min. A, control with vehicle (PBS) added. B, time course at 10 μM HgCl2. C, time course at 45 μM HgCl2 and D, at 118 μM HgCl2. The IC50 calculated from the velocity constants was 39 ± 6 μM, n = 16.
Figure 12
Figure 12. Establishment of a dose–response curve for the HCO3–Cl transport inhibitor DIDS
A dose–response curve has been derived from acidification experiments in the presence of various concentrations of DIDS. The time course of acidification was registered after incubation with DIDS for 10 min. A, control with vehicle (PBS) added. B, time course at 1.5 μM DIDS. C, time course in the presence of 7.5 μM DIDS and D, at 15 μM DIDS. The IC50 calculated from the velocity constants was 5.6 ± 1.2 μM, n = 25.
Figure 13
Figure 13. Comparison of acidification in the intracellular and extracellular compartment in control and inhibition experiments
Fluorescence inside the cell was measured as usual on BCECF-loaded cells. To measure outside the cells, ghosts were used that were not loaded with dye and added membrane-impermeant BCECF (free acid) to the outer compartment. A, control experiment (vehicle: PBS). B, same as A but with BCECF outside the cells. C, a, HgCl2 (10 μM) was added prior to DIDS (8 μM); b, DIDS (8 μM) was added prior to HgCl2 (10 μM). D, same as C a, but with BCECF outside the cells. E, DIDS (10 μM) present in the preparation, incubation 10 min. F, same as E, but with BCECF outside the cells.

Similar articles

Cited by

References

    1. Bisognano JD, Dix JA, Pratap PR, Novak TS, Freedman JC. Proton (or hydroxide) fluxes and the biphasic osmotic response of human red blood cells. J Gen Physiol. 1993;102:99–123. - PMC - PubMed
    1. Cooper GJ, Boron WF. Effect of pCMBS on CO2 permeability of Xenopus oocytes expressing aquaporin 1 or its C189S mutant. Am J Physiol. 1998;275:C1481–1486. - PubMed
    1. Cooper GJ, Zhou Y, Bouyer P, Grichtchenko II, Boron WF. Transport of volatile solutes through AQP1. J Physiol. 2002;542:17–29. - PMC - PubMed
    1. Denker BM, Smith BL, Kuhajda FP, Agre P. Identification, purification, and partial characterization of a novel Mr 28,000 integral membrane protein from erythrocytes and renal tubules. J Biol Chem. 1988;263:15634–15642. - PubMed
    1. Dodge JT, Mitchell C, Hanahan DJ. The preparation and chemical characteristics of hemoglobin-free ghosts of human erythrocytes. Arch Biochem Biophys. 1963;100:119–130. - PubMed

MeSH terms

LinkOut - more resources