. 2003 May 19;197(10):1233-44.
doi: 10.1084/jem.20020270.

Antigen-capturing cells can masquerade as memory B cells

Affiliations

Antigen-capturing cells can masquerade as memory B cells

Jennifer Bell et al. J Exp Med. .

Abstract

As well as classically defined switched immunoglobulin isotype-expressing B cells, memory B cells are now thought to include IgM-expressing cells and memory cells that lack B cell lineage markers, such as B220 or CD19. We set out to compare the relative importance of memory B cell subsets with an established flow cytometry method to identify antigen-specific cells. After immunization with PE, we could detect B220+ and, as reported previously, B220- antigen-binding cells (McHeyzer-Williams, L.J., M. Cool, and M.G. McHeyzer-Williams. 2001. J. Immunol. 167:1393-1405). The B220-PE+ cells bore few markers typical of B cells, but resembled myeloid cells. Further analysis of the antigen-binding characteristics of these cells showed that, upon immunization with two fluorescent proteins, the B220- cells could bind both. Furthermore, this subpopulation was detected in RAG1-/- mice after transfer of anti-PE mouse serum. These data strongly suggest that these cells capture serum Ig, via Fc receptors, and thus appear antigen-specific. Investigation of these antigen-capturing cells in a variety of knockout mice indicates that they bind monomeric IgG in an FcgammaR1 (CD64)-dependent manner. We find no evidence of a B220- memory B cell population that is not explicable by antigen-capturing cells, and warn that care must be taken when using antigen-specificity or surface IgG as an indicator of B cell memory.


Figures

Figure 1.
Figure 1.
Two populations of antigen-binding cells. (A) Spleen and bone marrow cells from an unimmunized mouse and a PE-immunized mouse, day 14, were stained for PE-binding activity and B220 expression. Plots are gated on live white cells. In each case, bone marrow and spleen are from the same mouse. Percentages of B220+PE+ and B220PE populations (box gates) of total white cells are shown above each gate. There is minimal background PE staining in the unimmunized mouse. Results shown are representative of at least 20 mice analyzed during this work. (B) B220+PE+ and B220PE+ cells were back-gated to show their forward scatter (FSC), x axis, and side scatter (SSC), y axis. Both plots are from the same mouse and are representative of at least five mice. (C) B220PE+ cells were FACS®-sorted from the bone marrow of PE-immunized mice. Cytospins of these sorted cells (top and middle) and of whole bone marrow (bottom) were stained with hematoxylin and eosin. B220PE+ cells are most similar in size and morphology to monocytes; they are unlike lymphocytes (L), or PMNs (N). All three panels are shown at the same magnification using 100× objective.
Figure 2.
Figure 2.
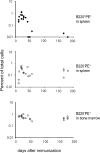
Maintenance of PE-binding cell populations over time. At various times after PE immunization, up to 180 d, the percentages of B220+PE+ cells in the spleen and B220PE+ cells in the spleen and bone marrow were measured by FACS® (as in Fig. 1 A). Each point plotted represents a single mouse.
Figure 3.
Figure 3.
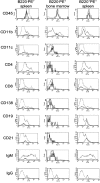
Surface phenotype of B220 and B220+ antigen-binding cells in spleen and bone marrow. Three-color FACS® analysis was used to assess the expression of various markers on B220PE+ cells and B220+PE+ from PE-immunized mice 2–5 wk after primary immunization. Cell populations were stained and gated as in Fig. 1 A. Panels show staining for the indicated marker of the gated population. Expression on the gated population is shown in bold (solid line) against that of either the whole spleen or bone marrow (dotted line). In the two bottom panels (MHC class I and CD1), the staining of the B220PE+ populations (gray-shaded profile) versus whole spleen or bone marrow cells (solid line) is shown. In each panel, the spleen and bone marrow stainings are from the same mouse. Profiles are representative of at least three mice analyzed.
Figure 3.
Figure 3.
Surface phenotype of B220 and B220+ antigen-binding cells in spleen and bone marrow. Three-color FACS® analysis was used to assess the expression of various markers on B220PE+ cells and B220+PE+ from PE-immunized mice 2–5 wk after primary immunization. Cell populations were stained and gated as in Fig. 1 A. Panels show staining for the indicated marker of the gated population. Expression on the gated population is shown in bold (solid line) against that of either the whole spleen or bone marrow (dotted line). In the two bottom panels (MHC class I and CD1), the staining of the B220PE+ populations (gray-shaded profile) versus whole spleen or bone marrow cells (solid line) is shown. In each panel, the spleen and bone marrow stainings are from the same mouse. Profiles are representative of at least three mice analyzed.
Figure 4.
Figure 4.
Response of B220PE+ cells to secondary immunization. Mice were primed with PE and rechallenged with PE in the absence of adjuvant 6 wk later. 0, 4, and 9 d after immunization, mice were killed, and spleen and bone marrow stained for B220 and PE-binding. The size of the gated B220PE+ population is shown as percentage of total cells. Two mice were taken at each time point. Plots show staining from a single mouse from each group, both mice gave similar results.
Figure 5.
Figure 5.
Dual specificity of B220PE+ cells. (A) Spleen and bone marrow were harvested from three C57Bl/6 mice immunized 4 wk before with: (a) APC alone; (b) PE alone; and (c) APC and PE together. Cells were stained with anti–CD19-FITC, PE, and APC, and analyzed by FACS®. Plots show PE (x axis) and APC (y axis) binding of the CD19 population. This experiment was repeated twice with the same result. (B) QM mice were immunized and boosted with APC. 2 wk later, spleens were harvested and analyzed by three-color flow cytometry for CD19 expression, NP binding, and APC binding. In each plot, CD19 is on the x axis. CD19NP+ (R2) are back-gated to show their APC binding activity and CD19APC+ (R3) cells are back-gated to show their NP binding activity. Data shown are from one mouse and are representative of three mice analyzed.
Figure 6.
Figure 6.
Transfer of PE-binding activity to RAG1−/− using sera from PE-immunized mice. Unimmunized C57BL/6 or RAG1−/− mice were given two intravenous injections of 200 μl of sera from a PE-immunized and boosted mouse. The second injection was given 24 h after the first, and mice were killed 18 h later. A profile from a positive control PE-immunized mouse is shown for comparison. Spleen and bone marrow were analyzed by FACS® for B220 and PE binding.
Figure 7.
Figure 7.
B220PE+ cells do not appear after immunization of FcR γ chain knockout mice. Various knockout mouse lines were immunized with PE. Spleen and bone marrow were harvested 3–5 wk later and analyzed by FACS® for B220 expression and PE-binding activity. (A–C) The mean percentage of B220PE+ cells (±SD, n = 3). (A) B220PE+ cells in β2m−/− and C57BL/6 mice. (B) B220PE+ cells in C1q−/−, FcγRIII−/−, and C57BL/6. (C) B220PE+ cells in FcR γ chain−/− and C57BL6. (D) Representative FACS® plots from FcR γ chain −/− and C57BL/6, spleen and bone marrow.
Figure 8.
Figure 8.
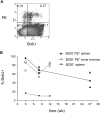
Turnover of B220PE+ and the B220+PE+ cells. BrdU incorporation into dividing cells over a 4-d period was assessed 3, 8, 12, and 27 wk after PE immunization. Spleen and bone marrow were analyzed by FACS® for PE binding and BrdU incorporation. B220+ cells in the spleen were also analyzed for BrdU incorporation at 3, 8, and 12 wk. (A) Typical BrdU/PE FACS® profile (from bone marrow at 8 wk). (B) Percentage of PE+ cells in the spleen and bone marrow that are BrdU+ after 4-d labeling, at various times after immunization. Each point represents an individual mouse with a line showing the mean value of each group.

References

    1. Schittek, B., and K. Rajewsky. 1990. Maintenance of B-cell memory by long-lived cells generated from proliferating precursors. Nature. 346:749–751. - PubMed
    1. McHeyzer-Williams, M.G., G.J. Nossal, and P.A. Lalor. 1991. Molecular characterization of single memory B cells. Nature. 350:502–505. - PubMed
    1. Gray, D. 1993. Immunological memory. Annu. Rev. Immunol. 11:49–77. - PubMed
    1. Klein, U., K. Rajewsky, and R. Kuppers. 1998. Human immunoglobulin (Ig)M+IgD+ peripheral blood B cells expressing the CD27 cell surface antigen carry somatically mutated variable region genes: CD27 as a general marker for somatically mutated (memory) B cells. J. Exp. Med. 188:1679–1689. - PMC - PubMed
    1. White, H., and D. Gray. 2000. Analysis of immunoglobulin (Ig) isotype diversity and IgM/D memory in the response to phenyl-oxazolone. J. Exp. Med. 191:2209–2220. - PMC - PubMed

Publication types