. 2003 Jun 10;100(12):7075-80.
doi: 10.1073/pnas.0832308100. Epub 2003 May 19.

Live tissue intrinsic emission microscopy using multiphoton-excited native fluorescence and second harmonic generation

Affiliations

Live tissue intrinsic emission microscopy using multiphoton-excited native fluorescence and second harmonic generation

Warren R Zipfel et al. Proc Natl Acad Sci U S A. .

Abstract

Multicolor nonlinear microscopy of living tissue using two- and three-photon-excited intrinsic fluorescence combined with second harmonic generation by supermolecular structures produces images with the resolution and detail of standard histology without the use of exogenous stains. Imaging of intrinsic indicators within tissue, such as nicotinamide adenine dinucleotide, retinol, indoleamines, and collagen provides crucial information for physiology and pathology. The efficient application of multiphoton microscopy to intrinsic imaging requires knowledge of the nonlinear optical properties of specific cell and tissue components. Here we compile and demonstrate applications involving a range of intrinsic molecules and molecular assemblies that enable direct visualization of tissue morphology, cell metabolism, and disease states such as Alzheimer's disease and cancer.


Figures

Fig. 3.
Fig. 3.
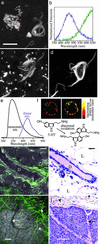
Extracellular emission sources. (a) Mouse arteriole with a fluorescent elastin lining (grayscale) and surrounded by collagen (SHG in green pseudocolor; scale bar, 20 μm). Elastin fibers from a human skin explant (740 nm; b) and SHG image (c) showing only collagen structure taken at 800 nm to avoid the elastin absorption. (d) In vivo spectrum collected from b.(e) SHG image of rat tail tendon. (f) SHG image of the articular cartilage-meniscus junction in mouse. In vivo SHG emission spectra from rat tail tendon (g) with different (color-coded) excitation wavelengths (h). 2PE fluorescence was not evident (arrow). (i) Relative SHG cross section for rat tendon (○) and a pure collagen I gel (•). (j) Collagen scaffolding (SHG, green) surrounding a cardiac myocyte (NAD(P)H, grayscale) in a mouse heart (740-nm excitation). (k) Collagenous periosteum (green) and calcein-loaded osteoblast precursors (grayscale) in a mouse femur imaged at 920 nm (SHG at 460 nm, 520-nm calcein emission). (l)F/B SHG as a function of fibril angle to the optical axis. (Inset) The expected SHG intensity profiles from variously oriented rods. (m) Backward-directed SHG image of an ≈10-μm-thick collagen gel (Upper, lateral projection; Lower, axial projection; scale bar, 5 μm). (n) Forward-directed SHG from the same collagen gel.
Fig. 4.
Fig. 4.
Examples of intrinsic fluorescence associated with disease-driven aggregation and oxidative stress. (a) NFTs of AD in unfixed tissue exhibit blue fluorescence (740-nm excitation, blue spectrum in b; scale bar, 10 μm). Granular structure is lipofuscin (green spectrum in b). A single autofluorescent NFT (c) and the same tangle stained with FITC/PHF-τ antibodies (d). (e) Serotonin is readily oxidized, forming blue and green mulitmers. (f) Serotonin-loaded granules in RBL-2H3 cells before and after a 5-min exposure to 1 μM hydrogen peroxide. (g and h) Intrinsic emission (750-nm excitation; g) and histological images of a normal mammary gland (h). The duct (D), composed of epithelial cells, exhibits punctate intracellular fluorescence (grayscale) and is surrounded by collagen scaffolding (green) and lipid-containing adipocytes (L). Intrinsic fluorescence (i) and histological (j) imaging of mammary carcinoma in a 230-day-old TgN(MMTVneu)202Mul mouse. Shown are monomorphous polygonal tumor cells (T) with few vessels (arrow) and virtually no collagen. Note loose collagenous stroma (green) at the tumor edge; cells between collagen fibers are hemosiderin-laden macrophages (arrowheads). h and j were prepared with hematoxylin-eosin staining. (Scale bars, 40 μm.)
Fig. 1.
Fig. 1.
Two-photon action cross sections and emission spectra from a basis set of biological molecules. (a) Action cross sections (absorption cross section multiplied by the fluorescence quantum yield) of six molecules that contribute much of the intracellular 2PE intrinsic fluorescence. Units: 1 GM (Göppert-Mayer) equals 10-50·cm4 s. All compounds were measured in buffered (pH 7.2) saline solution, except retinol and cholecalciferol (vit D), which were measured in EtOH. Riboflavin, cholecalciferol, and NADH were measured at 100 μM; retinol, folic acid, phylloquinone, pyridoxine, and nicotinamide were measured at 500 μM. (b) Emission spectra of the compounds shown in a (measured in the same solvents).
Fig. 2.
Fig. 2.
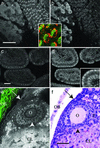
Intrinsic intracellular fluorescence sources. (a) 3PE emissions (<400 nm) show intracellular Trp in the choroid plexus (Left) and indoleamines in the pineal gland (Right) of a mouse. (b) 2PE-generated blue emissions (400–500 nm, presumably NADH). (Inset) A higher zoom image of the pinealocytes in a and b with the UV emission (green pseudocolor) and blue emission (red pseudocolor) merged to show they do not colocalize. (c) In the microvilli of the small intestine, uniform 3PE UV emission indicates the general protein distribution with punctate regions, suggesting indoleamine storage. (d) The blue emission is sufficient for discrimination between epithelial and goblet cells in the intestinal villi. MPM image (fluorescence in grayscale, SHG in green; e) and hematoxylin/eosin-stained histological images of a mouse ovary (f). The ovarian epithelium (arrow), oocyte (O), granulosa cells (arrowhead), thecal cells (T), the corpus luteum (CL), and ovarian bursa (OB) are all clearly resolvable and resemble the histological image in f. (Scale bars, 50 μm.)

References

    1. Denk, W., Strickler, J. H. & Webb, W. W. (1990) Science 248, 73-76. - PubMed
    1. Williams, R. M., Zipfel, W. R. & Webb, W. W. (2001) Curr. Opin. Chem. Biol. 5, 603-608. - PubMed
    1. Freund, I. & Deutsch, M. (1986) Opt. Lett. 11, 94-96. - PubMed
    1. Fine, S. & Hansen, W. P. (1971) Appl. Opt. 10, 2350-2553. - PubMed
    1. Freund, I., Deutsch, M. & Sprecher, A. (1986) Biophys. J. 50, 693-712. - PMC - PubMed

Publication types

LinkOut - more resources