. 2003 Jun;109(2):255-62.
doi: 10.1046/j.1365-2567.2003.01653.x.

Effect of cytofectins on the immune response of murine macrophages to mammalian DNA

Affiliations

Effect of cytofectins on the immune response of murine macrophages to mammalian DNA

Fu-Gang Zhu et al. Immunology. 2003 Jun.

Abstract

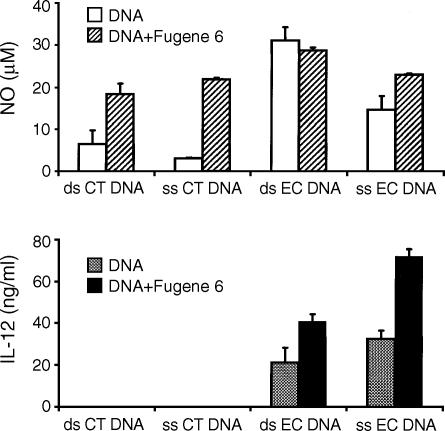
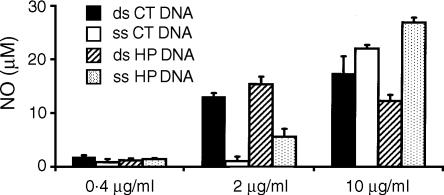
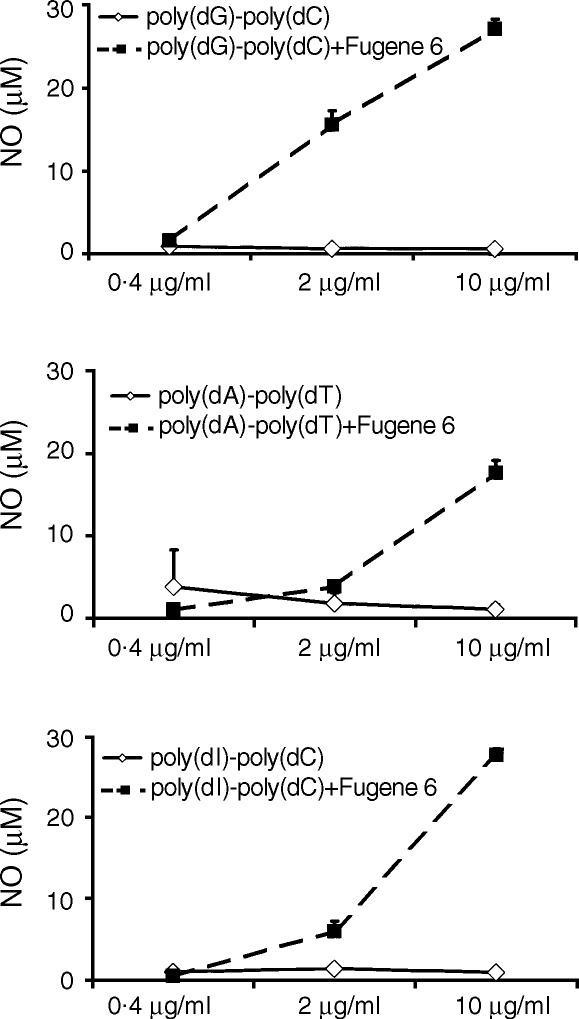
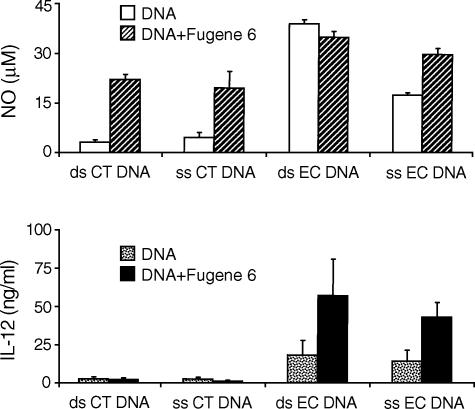
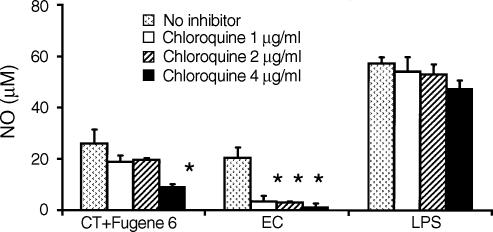
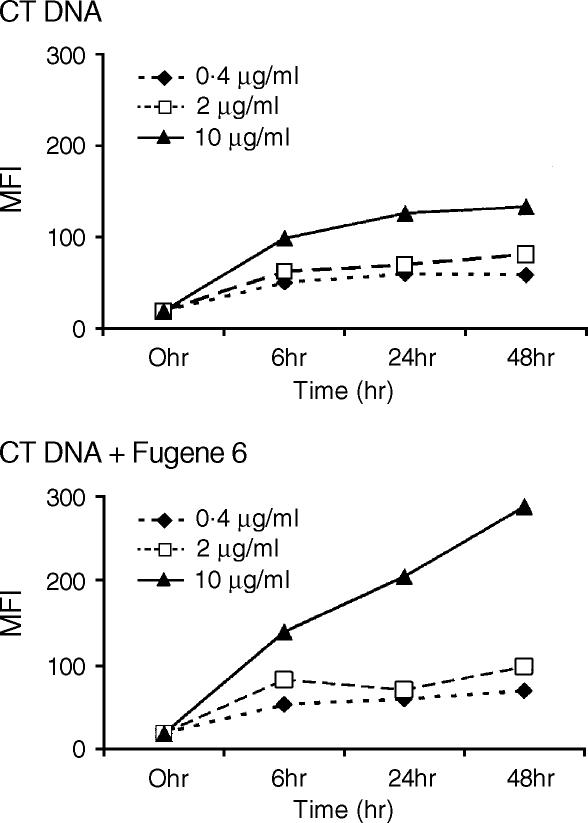
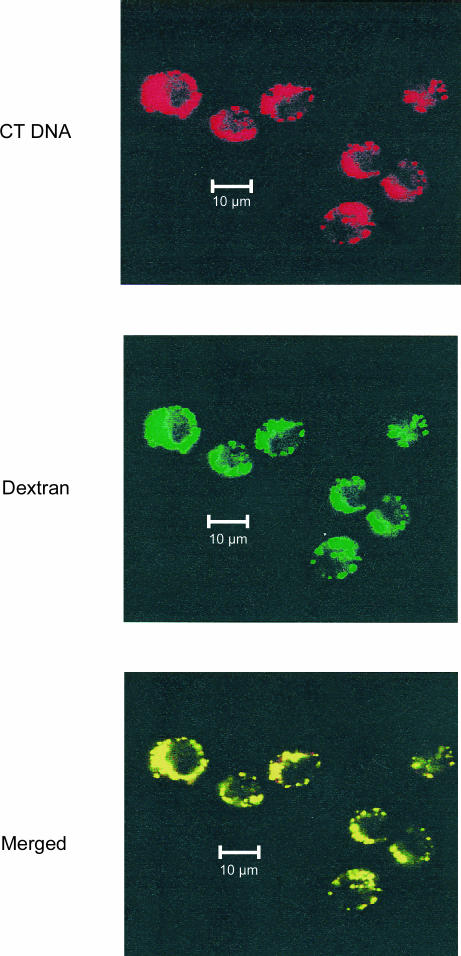
DNA, depending on base sequence, can induce a wide range of immune responses. While bacterial DNA is stimulatory, mammalian DNA is inactive alone and can, moreover, inhibit the response to bacterial DNA. To determine whether the mode of cell entry affects the immune properties of mammalian DNA, we have investigated the effects of the cytofectin agents Fugene 6 (Roche Diagnostics Corp., Indianapolis, IN), Lipofectin and Lipofectamine (Life Technologies, Grand Island, NY) on the responses of murine macrophages to DNA from calf thymus and human placenta. Whereas calf thymus and human placenta DNA alone failed to stimulate J774 or RAW264.7 cell lines or bone marrow-derived macrophages, these DNAs in complexes with cytofectin agents stimulated macrophages to produce nitric oxide but not interleukin 12. Both single-stranded and double-stranded DNAs were active in the presence of cytofectins. Macrophage activation by the DNA-cytofectin complexes was reduced by chloroquine, suggesting a role of endosomal acidification in activation. As shown by flow cytometry and confocal microscopy, the cytofectins caused an increase in the uptake of DNA into cells. Our findings indicate that macrophages vary in their response to DNA depending on uptake pathway, suggesting that activation by DNA reflects not only sequence but also context or intracellular location.


Figures

Figure 1
Figure 1
Induction of NO in macrophages by CT DNA–cytofectin complexes. J774 cells were treated for up to 48 hr with 10 µg/ml of ds and ss CT DNA in the presence or absence of Fugene 6. While CT DNA alone did not induce NO, both ds and ss CT DNA–cytofectin complexes induced NO from the cells (upper panel). These DNA–cytofectin complexes, however, had no effects on IL-12 production (lower panel). EC DNA, regardless of the presence of Fugene 6, stimulated J774 cells to produce IL-12 and NO. The NO levels in cells cultured with medium alone and Fugene 6 alone were 0·7 ± 0·02 and 3·1 ± 0·5 µm (mean ± SD), respectively, and IL-12 levels in these controls were less than 0·5 ng/ml. Each value represents a mean of triplicates. Error bars depict the standard deviations. The data are representative of at least three separate experiments.
Figure 2
Figure 2
Dose-dependent induction of NO from macrophages. RAW264·7 cells were treated for 48 hr with 0·4–10 µg/ml of ds and ss CT DNA or HP DNA with or without Fugene 6. In the presence of the lipid agent, both the ds and ss forms of these mammalian DNA stimulated macrophages to produce NO, although ds DNA induced more NO than ss DNA at a lower dose (2 µg/ml). NO levels of < 3 µm were detected in cells cultured with medium alone, Fugene 6 alone or DNA alone. Error bars depict the standard deviations. The data are representative of at least three separate experiments.
Figure 3
Figure 3
Induction of NO in macrophages by cytofectin complexes of synthetic nucleic acids. J774 cells were treated for 48 hr with 0·4–10 µg/ml of ds poly(dG)·poly(dC), poly(dA)·poly(dT), or poly(dI)·poly(dC) with or without Fugene 6. In complexes with the cytofectin agent, all three polymers induced NO, while these DNAs alone were inactive. NO levels in cells cultured with medium alone and Fugene 6 alone were < 2 µm. Each value represents a mean of triplicates. Error bars depict the standard deviations. The data are representative of at least three separate experiments.
Figure 4
Figure 4
Induction of NO in dendritic cells by CT DNA–cytofectin complexes. DCs were treated as in Fig. 1, and produced high levels of NO (upper panel), but not IL-12 (lower r panel), in response to ds or ss CT DNA–cytofectin complexes. EC DNA induced both NO and IL-12. NO levels of < 4 µm and IL-12 levels of < 4 ng/ml were detected in cells cultured with medium alone or Fugene 6 alone. Each value represents a mean of triplicates. Error bars depict the standard deviations. The data are representative of at least three separate experiments.
Figure 5
Figure 5
Effects of chloroquine on induction of NO by CT DNA–cytofectin complexes. J774 cells were pretreated with 1–4 µg/ml of chloroquine for 1 hr, followed by incubation with 10 µg/ml CT DNA in the presence of Fugene 6. EC DNA at 10 µg/ml and LPS at 1 µg/ml were used as controls. NO induction by CT DNA–cytofectin complexes was partially blocked by chloroquine. Whereas chloroquine blocked EC DNA-induced NO, it had a minimal effect on LPS activity. Error bars depict the standard deviations. The data are representative of at least three separate experiments. *P < 0·05 in a comparison of cells treated with CT DNA–cytofectin complexes or EC DNA in the presence and absence of chloroquine.
Figure 6
Figure 6
Effect of cytofectins on CT DNA uptake by macrophages. J774 cells were incubated for up to 48 hr with 0·4–10 µg/ml EMA-CT DNA with or without Fugene 6. DNA uptake was assessed by flow cytometric analysis of the cells collected at different time-points. The levels of DNA uptake are represented as mean fluorescence intensity (MFI) for each group. There was a dose- and time-dependent increase of DNA uptake in the presence of Fugene 6.
Figure 7
Figure 7
Confocal microscopy analysis of intracellular distribution of CT DNA. J774 cells were simultaneously incubated with 1 µg/ml of EMA-labelled CT DNA in complexes with Fugene 6 (CT DNA) and 0·5 mg/ml Oregon green-labelled dextran (Dextran) at 37° for 12 hr. Internalized CT DNA (red-coloured) and dextran (green-coloured) were examined by confocal microscopy. CT DNA can be seen mostly co-localized (yellow-coloured) with dextran (Merged), indicating a fluid phase endocytosis pathway for DNA uptake (bar = 10 µm).

Similar articles

Cited by

References

    1. Tokunaga T, Yamamoto H, Shimada S, et al. Antitumor activity of deoxyribonucleic acid fraction from Mycobacterium bovis BCG. I. Isolation, physicochemical characterization, and antitumor activity. J Natl Cancer Inst. 1984;72:955–62. - PubMed
    1. Messina JP, Gilkeson GS, Pisetsky DS. Stimulation of in vitro murine lymphocyte proliferation by bacterial DNA. J Immunol. 1991;147:1759–64. - PubMed
    1. Krieg AM, Yi AK, Matson S, Waldschmidt TJ, Bishop GA, Teasdale R, Koretzky GA, Klinman DM. CpG motifs in bacterial DNA trigger direct B-cell activation. Nature. 1995;374:546–9. - PubMed
    1. Krieg AM, Wu T, Weeratna R, et al. Sequence motifs in adenoviral DNA block immune activation by stimulatory CpG motifs. Proc Natl Acad Sci USA. 1998;95:12631–6. - PMC - PubMed
    1. Pisetsky DS, Reich CF. Inhibition of murine macrophage IL-12 production by natural and synthetic DNA. Clin Immunol. 2000;96:198–204. - PubMed

Publication types