

Noncharged amino acid residues at the solvent-exposed positions in the middle and at the C terminus of the alpha-helix have the same helical propensity
- PMID: 12761387
- PMCID: PMC2323897
- DOI: 10.1110/ps.0304303
Noncharged amino acid residues at the solvent-exposed positions in the middle and at the C terminus of the alpha-helix have the same helical propensity
Abstract
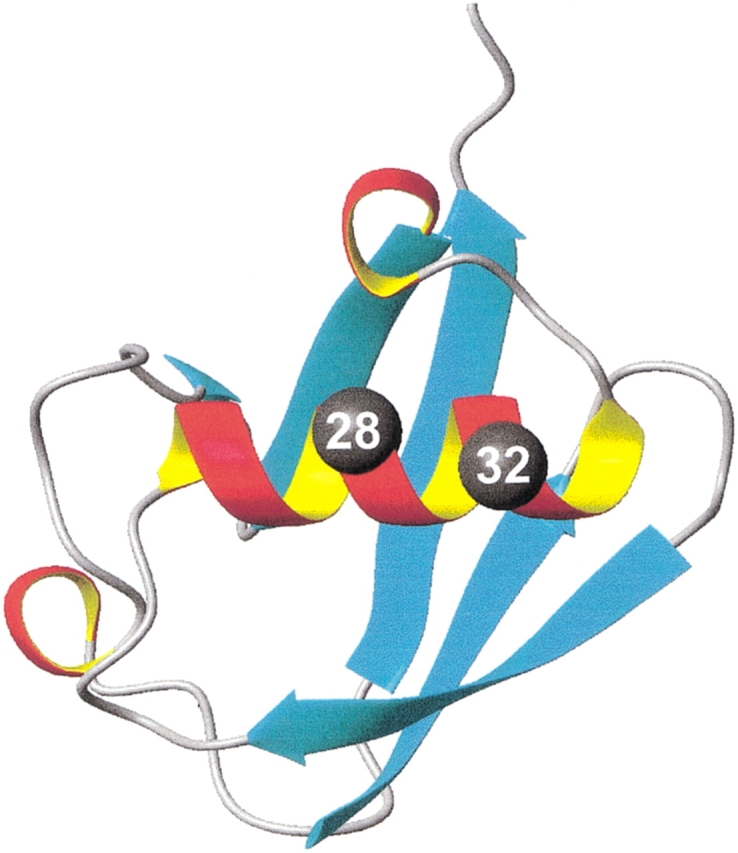
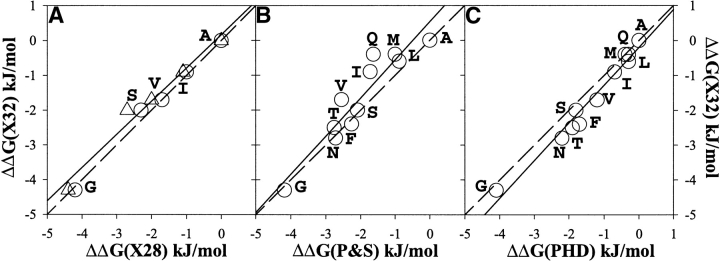
It was established previously that helical propensities of different amino acid residues in the middle of alpha-helix in peptides and in proteins are very similar. The statistical analysis of the protein helices from the known three-dimensional structures shows no difference in the frequency of noncharged residues in the middle and at the C terminus. Yet, experimental studies show distinctive differences for the helical propensities of noncharged residues in the middle and in the C terminus in model peptides. Is this a general effect, and is it applicable to protein helices or is it specific to the model alanine-based peptides? To answer this question, the effects of substitutions at positions 28 (middle residue) and 32 (C2 position at the C terminus) of the alpha-helix of ubiquitin on the stability of this protein are measured by using differential scanning calorimetry. The two data sets produce similar values for intrinsic helix propensity, leading to a conclusion that noncharged amino acid residues at the solvent-exposed positions in the middle and at the C terminus of the alpha-helix have the same helical propensity. This conclusion is further supported with an excellent correlation between the helix propensity scale obtained for the two positions in ubiquitin with the experimental helix propensity scale established previously and with the statistical distribution of the residues in protein helices.
Figures
References
-
- Aurora, R., Srinivasan, R., and Rose, G.D. 1994. Rules for α-helix termination by glycine. Science 264 1126–1130. - PubMed
-
- Blaber, M., Zhang, X.J., and Matthews, B.W. 1993. Structural basis of amino acid α helix propensity. Science 260 1637–1640. - PubMed
-
- Blaber, M., Zhang, X.J., Lindstrom, J.D., Pepiot, S.D., Baase, W.A., and Matthews, B.W. 1994. Determination of α-helix propensity within the context of a folded protein: Sites 44 and 131 in bacteriophage T4 lysozyme. J. Mol. Biol. 235 600–624. - PubMed
-
- Blagdon, D.E. and Goodman, M. 1975. Mechanisms of protein and polypeptide helix initiation. Biopolymers 14 241–245. - PubMed
Publication types
MeSH terms
Substances
Grants and funding
LinkOut - more resources
Full Text Sources
Other Literature Sources
Miscellaneous
