Comparative Study
. 2003 Jun;12(6):1222-31.
doi: 10.1110/ps.0239703.

Why is Leu55-->Pro55 transthyretin variant the most amyloidogenic: insights from molecular dynamics simulations of transthyretin monomers

Affiliations
Comparative Study

Why is Leu55-->Pro55 transthyretin variant the most amyloidogenic: insights from molecular dynamics simulations of transthyretin monomers

Mingfeng Yang et al. Protein Sci. 2003 Jun.

Abstract

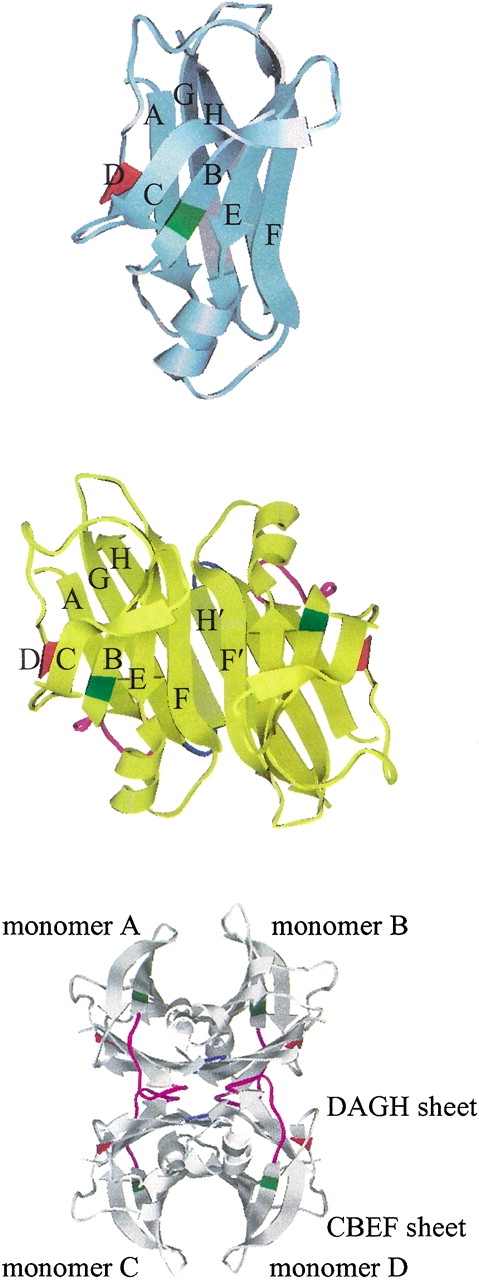
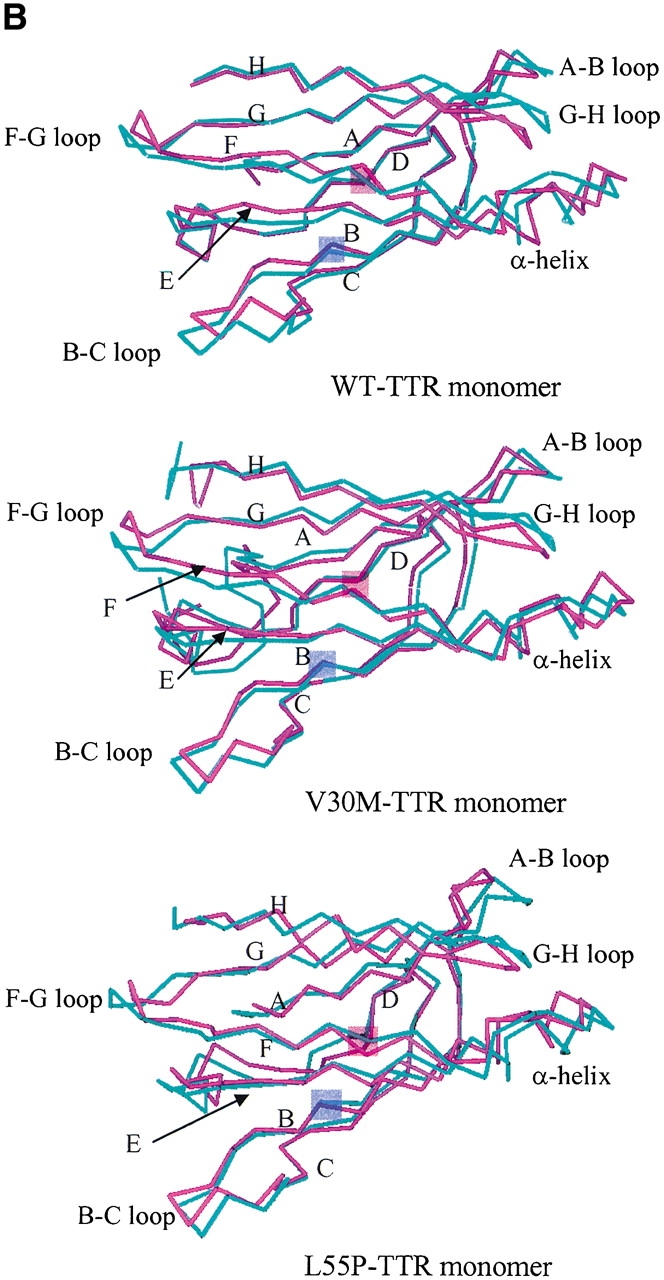
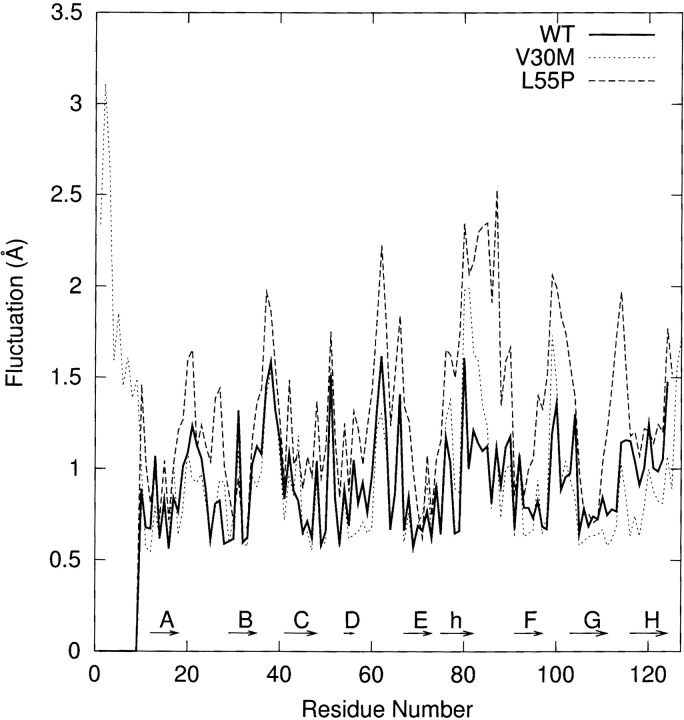
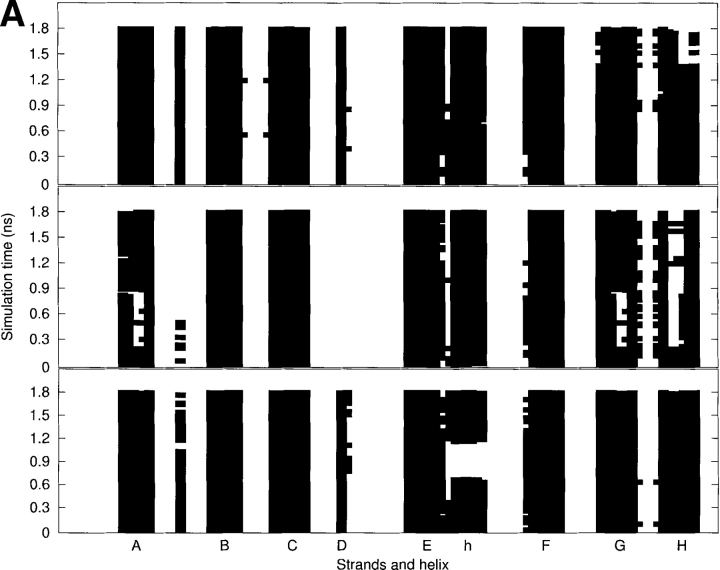
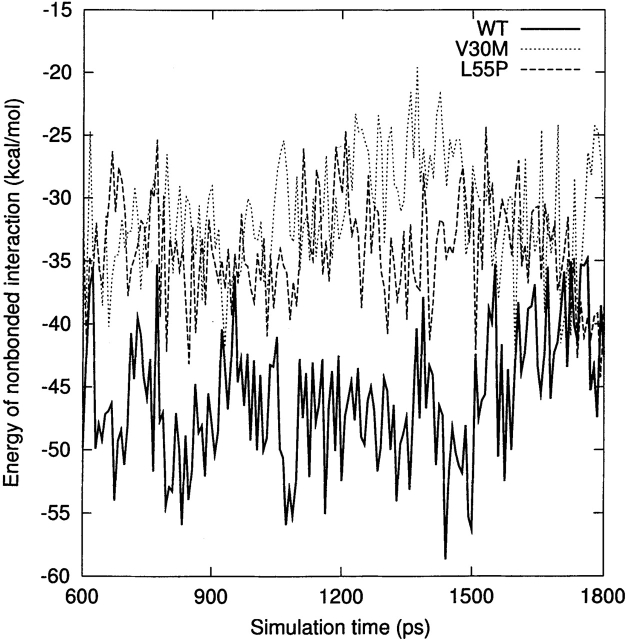
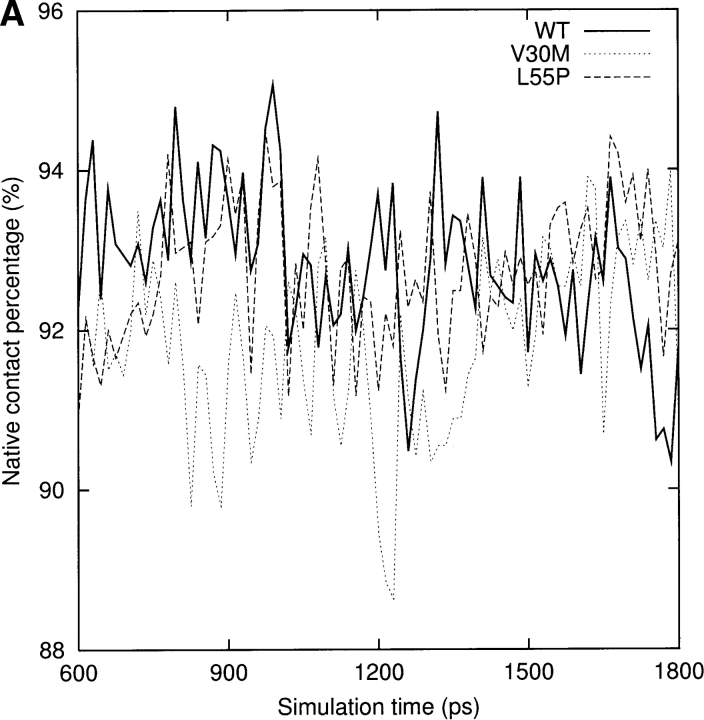
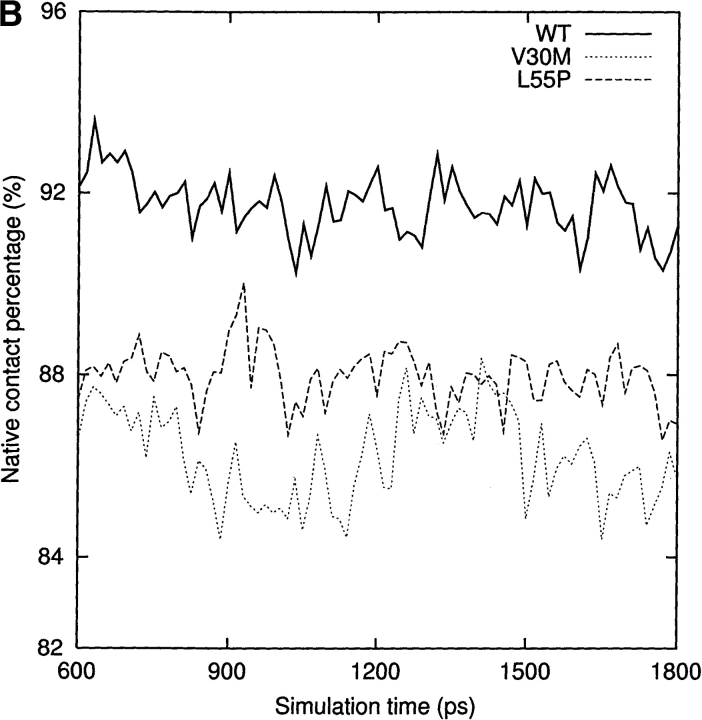
Transthyretin (TTR) is one of the known human amyloidogenic proteins. Its native state is a homotetramer with each monomer having a beta-sandwich structure. Strong experimental evidence suggests that TTR dissociates into monomeric intermediates and that the monomers subsequently self-assemble to form amyloid deposits and insoluble fibrils. However, details on the early steps along the pathway of TTR amyloid formation are unclear, although various experimental approaches with resolutions at the molecular or residue level have provided some clues. It is highly likely that the stability and flexibility of monomeric TTR play crucial roles in the early steps of amyloid formation; thereby, it is essential to characterize initial conformational changes of TTR monomers. In this article we probe the possibility that the differences in the monomeric forms of wild-type (WT) TTR and its variants are responsible for differential amyloidogenesis. We begin with the simulations of WT, Val30-->Met (V30M), and Leu55-->Pro (L55P) TTR monomers. Nanosecond time scale molecular dynamics simulations at 300 K were performed using AMBER. The results indicate that the L55P-TTR monomer undergoes substantial structural changes relative to fluctuations observed in the WT and V30M TTR monomers. The observation supports earlier speculation that the L55P mutation may lead to disruption of the beta-sheet structure through the disorder of the "edge strands" that might facilitate amyloidogenesis.


Figures

Figure 1.
Figure 1.
Three-dimensional structure of WT-TTR (PDB entry 1DVQ). The monomer, the dimer, and the tetramer are shown in the top, the middle, and the bottom, respectively. Two monomers are related by a noncrystallographic twofold axis. The native structure is a homotetramer. We generated the tetramer structure from the dimer coordinates using the transformation matrix provided in the PDB file. The eight β-strands are named from A to H. The residue ranges that make up the β-strands are listed in Materials and Methods. The α-helix is from T75 to L82. The same designation is used in all of the figures. Leu55 is in red and Val30 is in green. In the tetrameric complex, the A–B loop (magenta) in monomer A contacts the G–H loop (blue) in monomer D, while the G–H loop in monomer A interacts with the A–B loop of monomer D. The monomer B interacts with monomer C through the same loop contacts.
Figure 2.
Figure 2.
(A) The root-mean-square (RMS) deviation of the main chain atoms in the β-sheet region relative to the corresponding initial structure as a function of simulation time. Block averaging was used with 15 psec per block. (B) Superposition of the α-carbons of the initial structure of the simulation (cyan) and the average structure along the trajectory (magenta). Residue number 30 and 55 are shaded in violet and in pink, respectively.
Figure 2.
Figure 2.
(A) The root-mean-square (RMS) deviation of the main chain atoms in the β-sheet region relative to the corresponding initial structure as a function of simulation time. Block averaging was used with 15 psec per block. (B) Superposition of the α-carbons of the initial structure of the simulation (cyan) and the average structure along the trajectory (magenta). Residue number 30 and 55 are shaded in violet and in pink, respectively.
Figure 3.
Figure 3.
The residue averages of the RMS fluctuations for the main chain atoms during the last 1.2 nsec MD simulation. “h” denotes the α-helix.
Figure 4.
Figure 4.
(A) The secondary structure analyses along the MD trajectories using DSSP (Kabsch and Sander 1983) for the WT (top), L55P (middle), and V30M (bottom) TTR monomers. More attention should be paid to the results after 600 psec (0.6 nsec). The β-strands are named from A to H. “h” denotes the α-helix. A solid square represents that a residue adopts the β-sheet or α-helix conformation. (B) The schematic representations of hydrogen bonds between backbone amide groups in the β-sandwich region. The solid arrow denotes the hydrogen bond that is persistent in the three monomers; the dashed-line arrow and the dotted-line arrow denote the hydrogen bond with low occupancy (<70%) in the L55P-TTR monomer and WT-TTR monomer, respectively; the dotted/dashed-line arrow represents the hydrogen bond with low occupancy (<70%) in both L55P and WT monomers. Arrow points from hydrogen bond donor to acceptor.
Figure 4.
Figure 4.
(A) The secondary structure analyses along the MD trajectories using DSSP (Kabsch and Sander 1983) for the WT (top), L55P (middle), and V30M (bottom) TTR monomers. More attention should be paid to the results after 600 psec (0.6 nsec). The β-strands are named from A to H. “h” denotes the α-helix. A solid square represents that a residue adopts the β-sheet or α-helix conformation. (B) The schematic representations of hydrogen bonds between backbone amide groups in the β-sandwich region. The solid arrow denotes the hydrogen bond that is persistent in the three monomers; the dashed-line arrow and the dotted-line arrow denote the hydrogen bond with low occupancy (<70%) in the L55P-TTR monomer and WT-TTR monomer, respectively; the dotted/dashed-line arrow represents the hydrogen bond with low occupancy (<70%) in both L55P and WT monomers. Arrow points from hydrogen bond donor to acceptor.
Figure 5.
Figure 5.
The RMS fluctuation of backbone torsional angle φ as a function of residue number for the last 1.2 nsec. The β-strands are named from A to H. “h” denotes α-helix.
Figure 6.
Figure 6.
The nonbonded interaction energy (Coulomb interaction and van der Waals interaction) between the CBEF and DAGH sheets as a function of simulation time for the last 1.2 nsec. See Materials and Methods for the residue ranges that make up the two sheets.
Figure 7.
Figure 7.
(A) The percentage of native contacts in the β-sheet region for the last 1.2 nsec. Block averaging was used with 15 psec per block. See Materials and Methods for the residue ranges that make up the two sheets. (B) The percentage of native contacts for the entire monomers during the last 1.2 nsec. Block averaging was used with 15 psec per block.
Figure 7.
Figure 7.
(A) The percentage of native contacts in the β-sheet region for the last 1.2 nsec. Block averaging was used with 15 psec per block. See Materials and Methods for the residue ranges that make up the two sheets. (B) The percentage of native contacts for the entire monomers during the last 1.2 nsec. Block averaging was used with 15 psec per block.

Similar articles

Cited by

References

    1. Adams, D. and Said, G. 1996. Ultrastructural immunolabelling of amyloid fibrils in acquired and hereditary amyloid neuropathies. J. Neurol. 243 63–67. - PubMed
    1. Bashford, D. and Case, D.A. 2000. Generalized born models of macromolecular solvation effects. Annu. Rev. Phys. Chem. 51 129–152. - PubMed
    1. Batschelet, E. 1981. Circular statistics in biology. Academic Press, Inc., New York.
    1. Berendsen, H.J.C., Postma, J.P.M., van Gunsteren, W.F., DiNola, A., and Haak, J.R. 1984. Molecular dynamics with coupling to an external bath. J. Chem. Phys. 81 3684–3690.
    1. Blake, C.C., Geisow, M.J., Oatley, S.J., Rerat, B., and Rerat, C. 1978. Structure of prealbumin: Secondary, tertiary and quaternary interactions determined by Fourier refinement at 1.8 Å. J. Mol. Biol. 121 339–356. - PubMed

Publication types