Effects of sucrose on conformational equilibria and fluctuations within the native-state ensemble of proteins
- PMID: 12761396
- PMCID: PMC2323899
- DOI: 10.1110/ps.0242603
Effects of sucrose on conformational equilibria and fluctuations within the native-state ensemble of proteins
Abstract
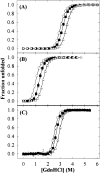
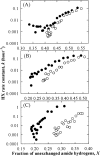
Osmolytes increase the thermodynamic conformational stability of proteins, shifting the equilibrium between native and denatured states to favor the native state. However, their effects on conformational equilibria within native-state ensembles of proteins remain controversial. We investigated the effects of sucrose, a model osmolyte, on conformational equilibria and fluctuations within the native-state ensembles of bovine pancreatic ribonuclease A and S and horse heart cytochrome c. In the presence of sucrose, the far- and near-UV circular dichroism spectra of all three native proteins were slightly altered and indicated that the sugar shifted the native-state ensemble toward species with more ordered, compact conformations, without detectable changes in secondary structural contents. Thermodynamic stability of the proteins, as measured by guanidine HCl-induced unfolding, increased in proportion to sucrose concentration. Native-state hydrogen exchange (HX) studies monitored by infrared spectroscopy showed that addition of 1 M sucrose reduced average HX rate constants at all degrees of exchange of the proteins, for which comparison could be made in the presence and absence of sucrose. Sucrose also increased the exchange-resistant core regions of the proteins. A coupling factor analysis relating the free energy of HX to the free energy of unfolding showed that sucrose had greater effects on large-scale than on small-scale fluctuations. These results indicate that the presence of sucrose shifts the conformational equilibria toward the most compact protein species within native-state ensembles, which can be explained by preferential exclusion of sucrose from the protein surface.
Figures


References
-
- Barksdale, A.D. and Rosenberg, A. 1983. Acquisition and interpretation of hydrogen exchange data from peptides, polymers, and proteins. Methods Biochem. Anal. 28 1–111. - PubMed
-
- Burg, M.B., Kwon, E.D., and Peters, E.M. 1996. Glycerophosphocholine and betaine counteract the effect of urea on pyruvate kinase. Kidney Int. Suppl. 57 S100–S104. - PubMed
-
- Catanzano, F., Giancola, C., Graziano, G., and Barone, G. 1996. Temperature-induced denaturation of ribonuclease S: A thermodynamic study. Biochemistry 35 13378–13385. - PubMed
Publication types
MeSH terms
Substances
LinkOut - more resources
Full Text Sources

