

Differential regulation of SOCS genes in normal and transformed erythroid cells
- PMID: 12761492
- PMCID: PMC2396148
- DOI: 10.1038/sj.onc.1206381
Differential regulation of SOCS genes in normal and transformed erythroid cells
Abstract
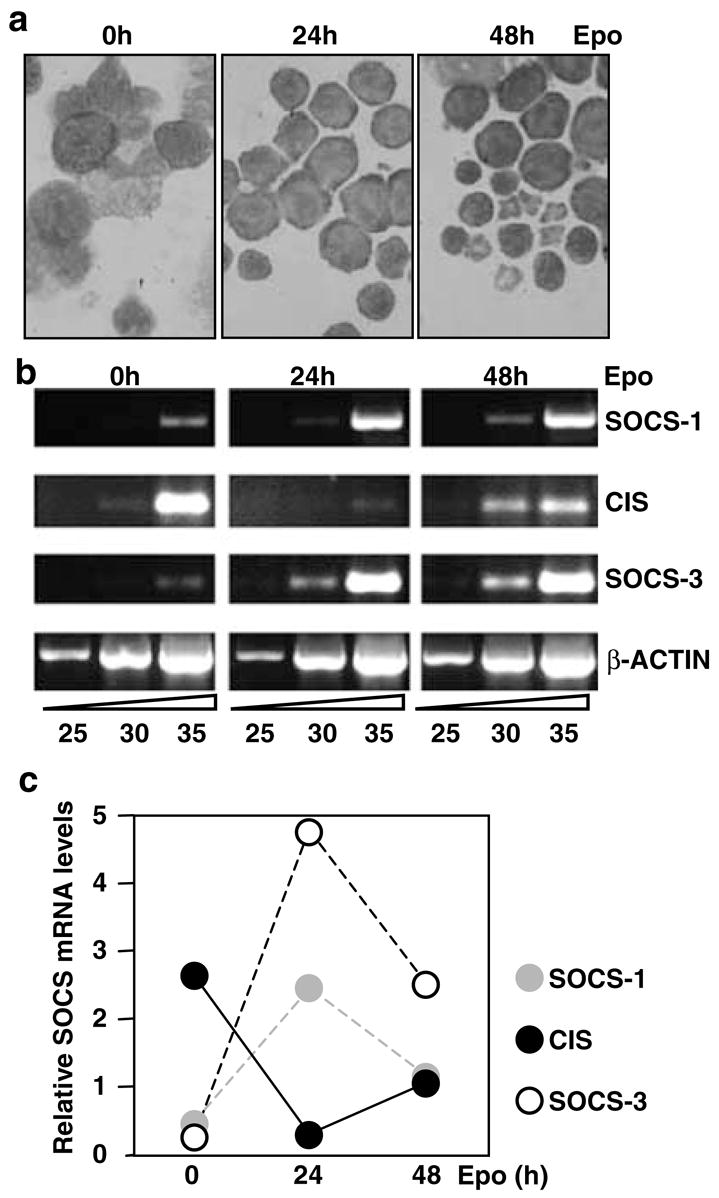
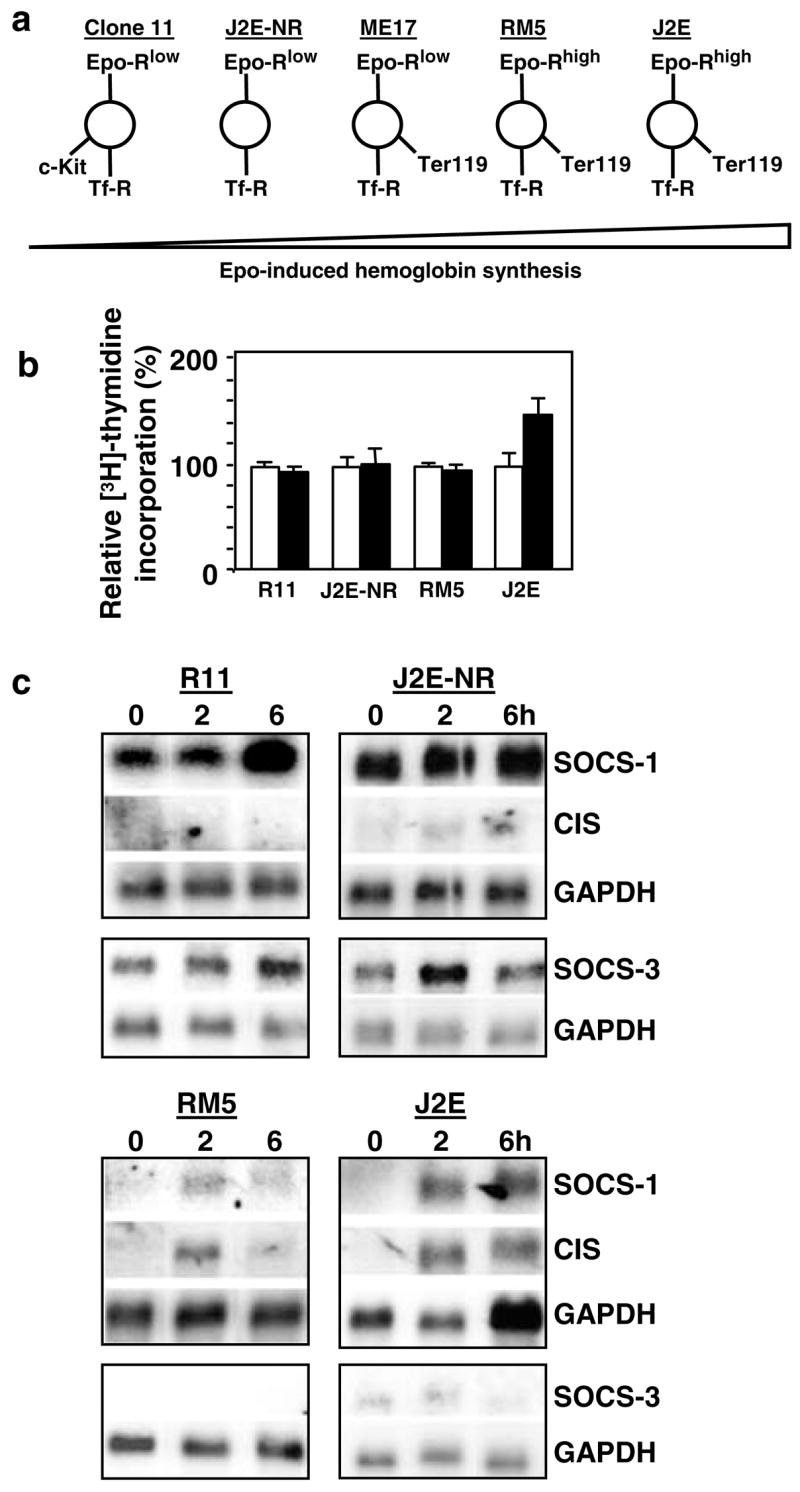
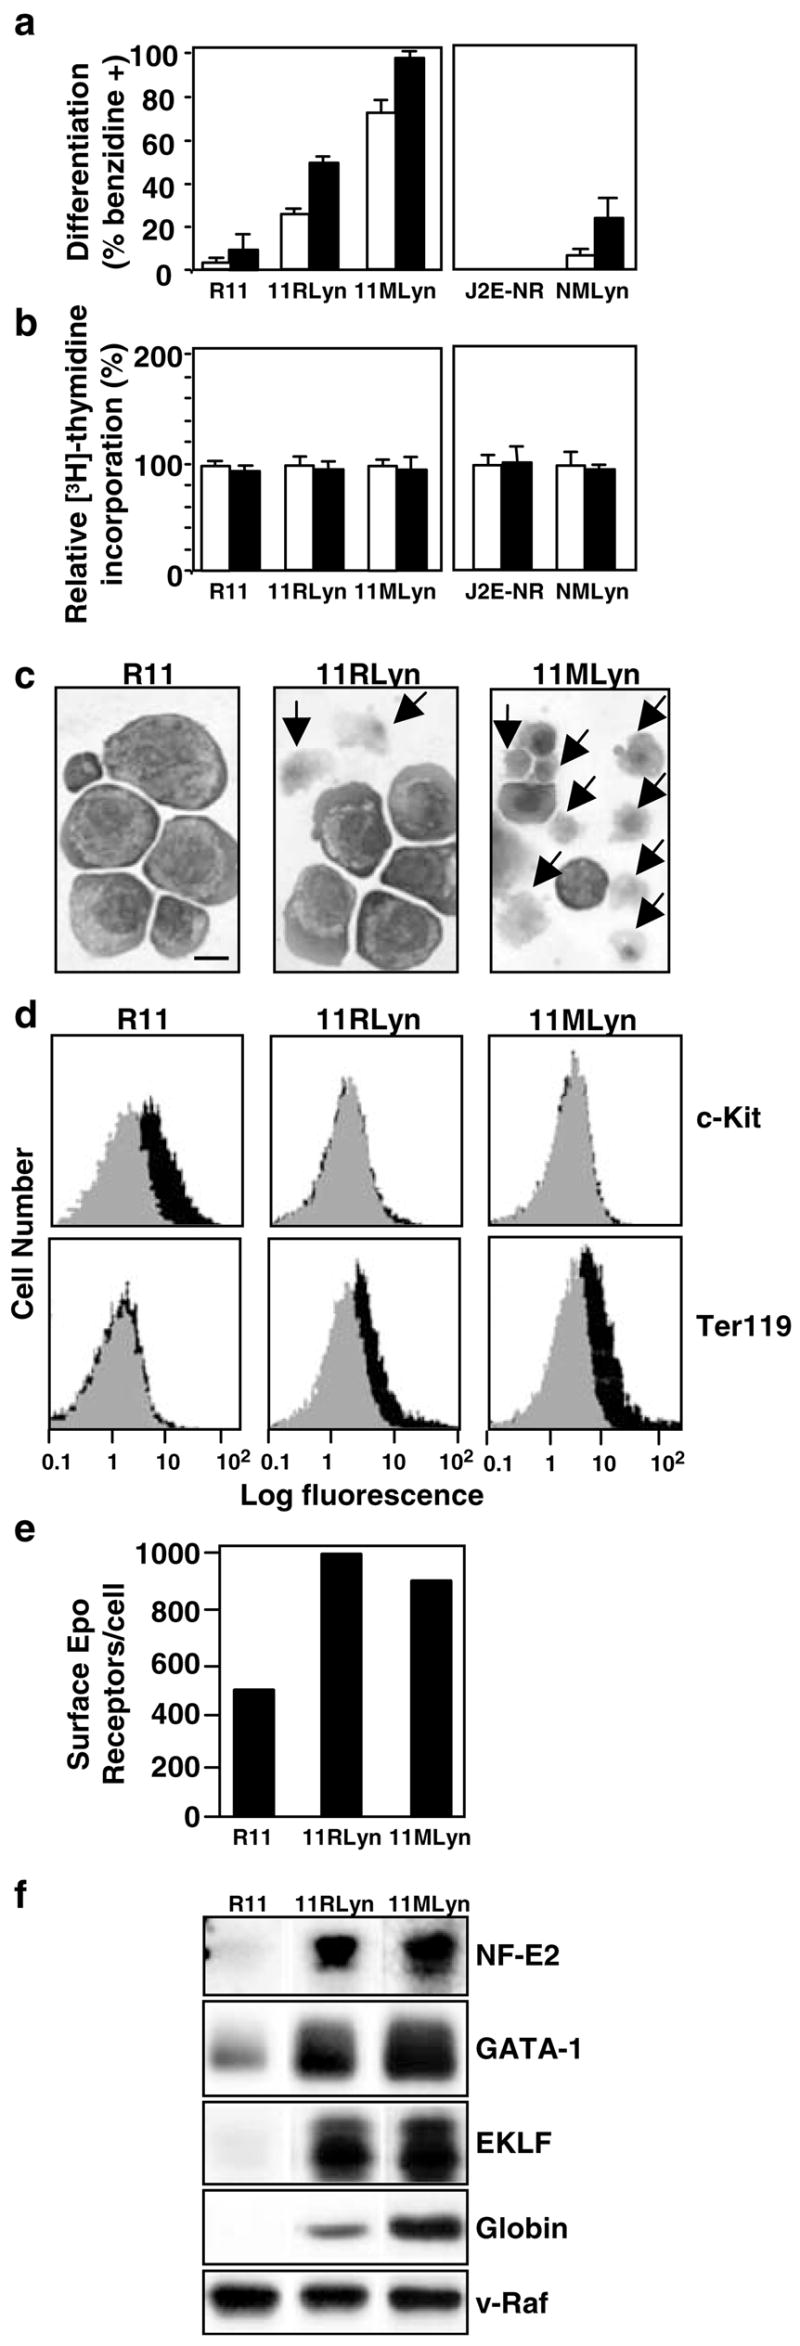
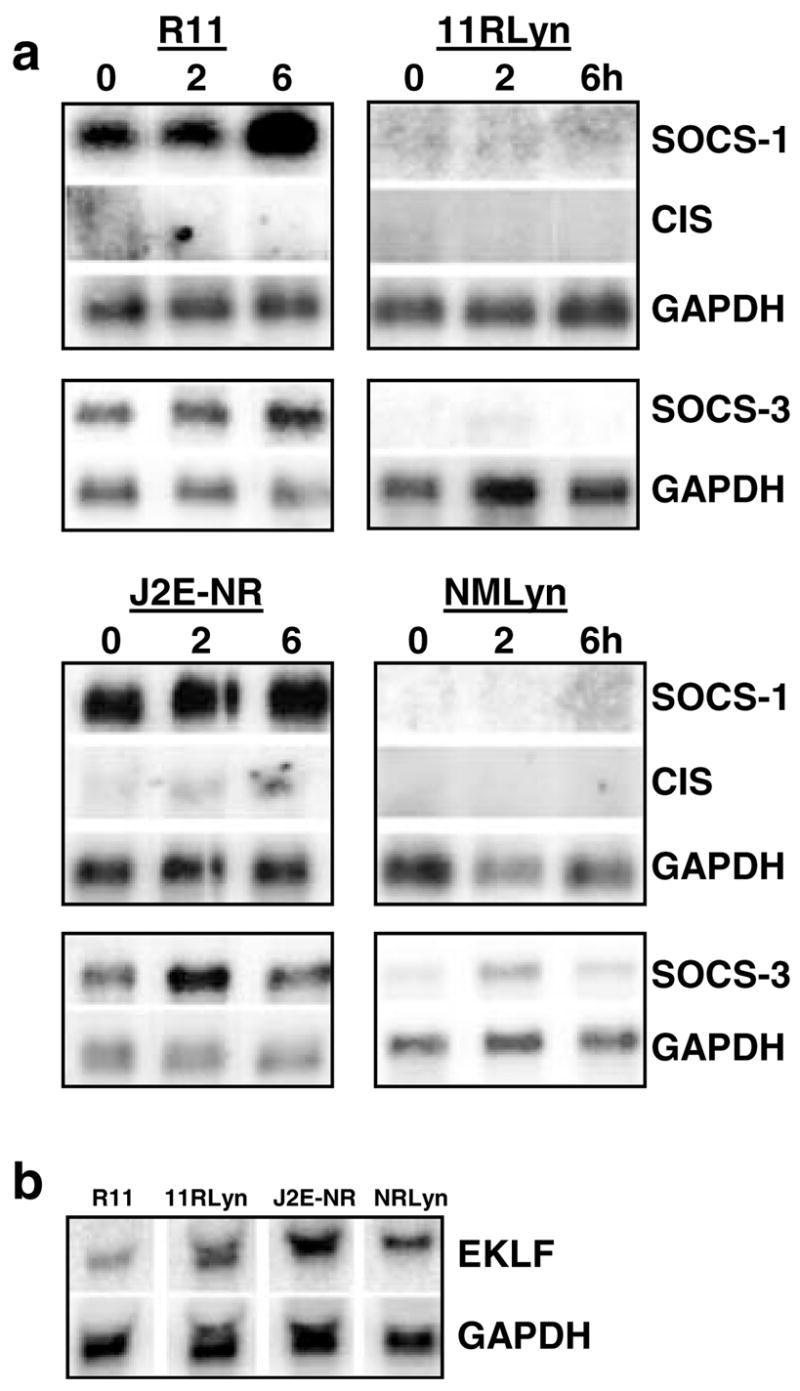
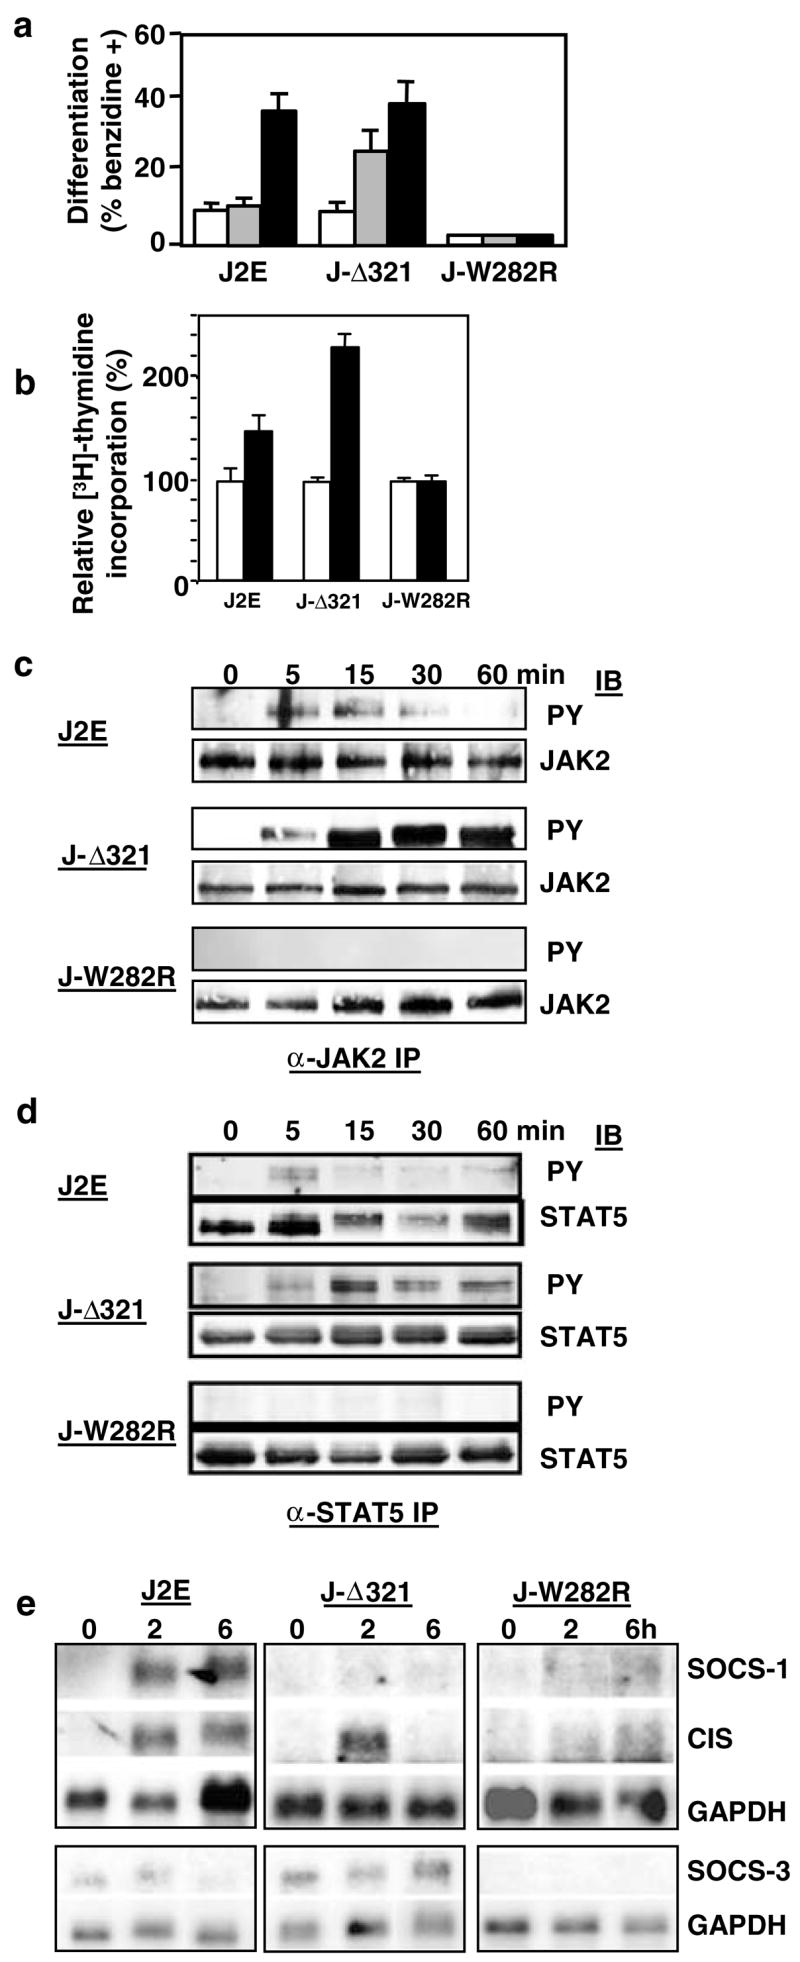
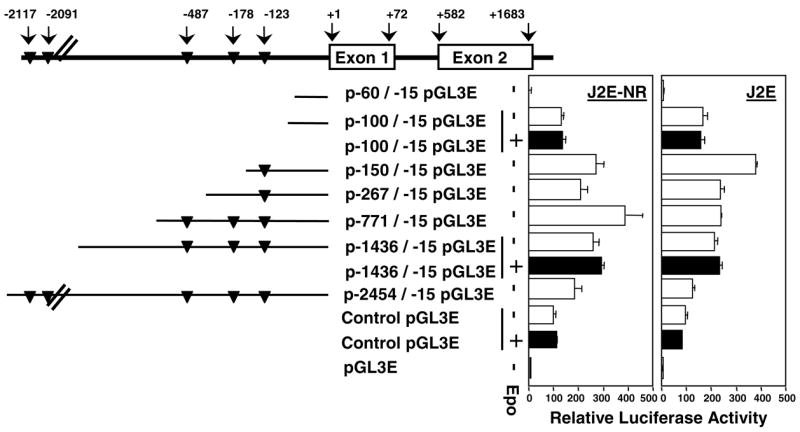
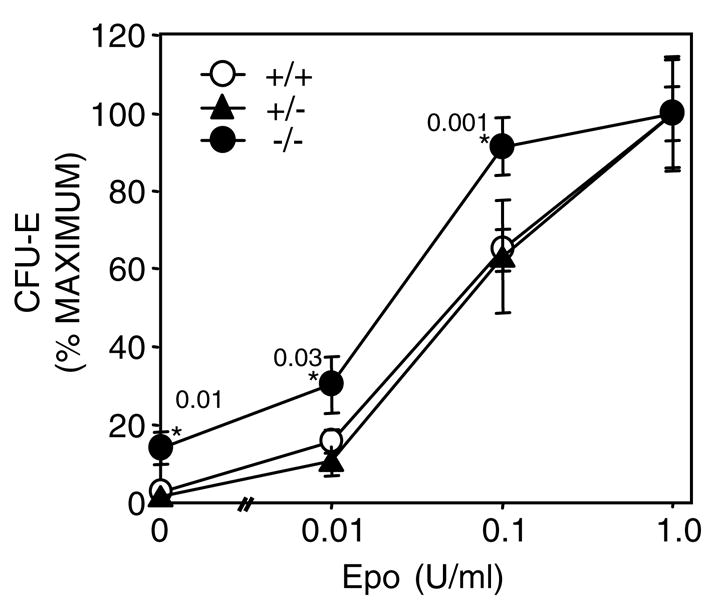
The SOCS family of genes are negative regulators of cytokine signalling with SOCS-1 displaying tumor suppressor activity. SOCS-1, CIS and SOCS-3 have been implicated in the regulation of red blood cell production. In this study, a detailed examination was conducted on the expression patterns of these three SOCS family members in normal erythroid progenitors and a panel of erythroleukemic cell lines. Unexpectedly, differences in SOCS gene expression were observed during maturation of normal red cell progenitors, viz changes to CIS were inversely related to the alterations of SOCS-1 and SOCS-3. Similarly, these SOCS genes were differentially expressed in transformed erythoid cells - erythroleukemic cells immortalized at an immature stage of differentiation expressed SOCS-1 and SOCS-3 mRNA constitutively, whereas in more mature cell lines SOCS-1 and CIS were induced only after exposure to erythropoietin (Epo). Significantly, when ectopic expression of the tyrosine kinase Lyn was used to promote differentiation of immature cell lines, constitutive expression of SOCS-1 and SOCS-3 was completely suppressed. Modulation of intracellular signalling via mutated Epo receptors in mature erythroleukemic lines also highlighted different responses by the three SOCS family members. Close scrutiny of SOCS-1 revealed that, despite large increases in mRNA levels, the activity of the promoter did not alter after erythropoietin stimulation; in addition, erythroid cells from SOCS-1-/- mice displayed increased sensitivity to Epo. These observations indicate complex, stage-specific regulation of SOCS genes during normal erythroid maturation and in erythroleukemic cells.
Figures
Similar articles
-
Differential roles of SOCS family members in EpoR signal transduction.J Interferon Cytokine Res. 2002 Aug;22(8):853-60. doi: 10.1089/107999002760274863. J Interferon Cytokine Res. 2002. PMID: 12396724
-
Inhibition and restoration of prolactin signal transduction by suppressors of cytokine signaling.J Biol Chem. 1999 Aug 27;274(35):24497-502. doi: 10.1074/jbc.274.35.24497. J Biol Chem. 1999. PMID: 10455112
-
Lyn kinase plays important roles in erythroid expansion, maturation and erythropoietin receptor signalling by regulating inhibitory signalling pathways that control survival.Biochem J. 2014 May 1;459(3):455-66. doi: 10.1042/BJ20130903. Biochem J. 2014. PMID: 24552351
-
Suppressors of cytokine signalling: SOCS.APMIS. 2002 Dec;110(12):833-44. doi: 10.1034/j.1600-0463.2002.1101201.x. APMIS. 2002. PMID: 12645661 Review.
-
Suppressors of cytokine signaling: Relevance to gastrointestinal function and disease.Gastroenterology. 2002 Dec;123(6):2064-81. doi: 10.1053/gast.2002.37068. Gastroenterology. 2002. PMID: 12454862 Review.
Cited by
-
Lnk inhibits erythropoiesis and Epo-dependent JAK2 activation and downstream signaling pathways.Blood. 2005 Jun 15;105(12):4604-12. doi: 10.1182/blood-2004-10-4093. Epub 2005 Feb 10. Blood. 2005. PMID: 15705783 Free PMC article.
-
Identification of contact sites between ankyrin and band 3 in the human erythrocyte membrane.Biochemistry. 2012 Aug 28;51(34):6838-46. doi: 10.1021/bi300693k. Epub 2012 Aug 14. Biochemistry. 2012. PMID: 22861190 Free PMC article.
-
DYRK3 dual-specificity kinase attenuates erythropoiesis during anemia.J Biol Chem. 2008 Dec 26;283(52):36665-75. doi: 10.1074/jbc.M807844200. Epub 2008 Oct 14. J Biol Chem. 2008. PMID: 18854306 Free PMC article.
-
Direct targets of pSTAT5 signalling in erythropoiesis.PLoS One. 2017 Jul 21;12(7):e0180922. doi: 10.1371/journal.pone.0180922. eCollection 2017. PLoS One. 2017. PMID: 28732065 Free PMC article.
-
Loss of JAK2 regulation via a heterodimeric VHL-SOCS1 E3 ubiquitin ligase underlies Chuvash polycythemia.Nat Med. 2011 Jun 19;17(7):845-53. doi: 10.1038/nm.2370. Nat Med. 2011. PMID: 21685897 Free PMC article.
References
-
- Alexander WS, Starr R, Fenner JE, Scott CL, Handman E, Sprigg NS, Corbin JE, Cornish AL, Darwiche R, Owczarek CM, Kay TWH, Nicola NA, Hertzog PJ, Metcalf D, Hilton DJ. Cell. 1999;98:597–608. - PubMed
-
- Andrews NC, Erdjument-Bomage H, Davidson MB, Tempst P, Orkin SH. Nature. 1993;362:722–728. - PubMed
-
- Bromberg JF, Wrzeszczynska MH, Devgan G, Zhao Y, Pestell RG, Albanese C, Darnell JE., Jr Cell. 1999;98:295–303. - PubMed
-
- Brysha M, Zhang J, Bertolino P, Corbin J, Alexander W, Nicola N, Hilton D, Starr R. J Biol Chem. 2001;276:22086–22089. - PubMed
Publication types
MeSH terms
Substances
Grants and funding
LinkOut - more resources
Full Text Sources
Other Literature Sources
Research Materials
Miscellaneous
