

Functional correlations between neighboring neurons in the primate globus pallidus are weak or nonexistent
- PMID: 12764086
- PMCID: PMC6741070
- DOI: 10.1523/JNEUROSCI.23-10-04012.2003
Functional correlations between neighboring neurons in the primate globus pallidus are weak or nonexistent
Abstract
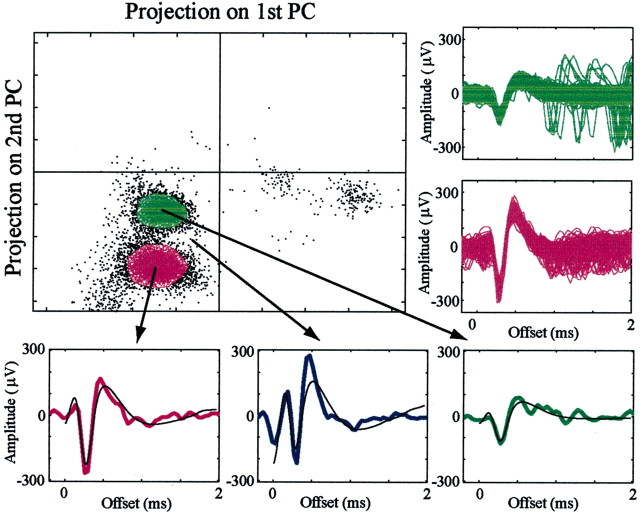
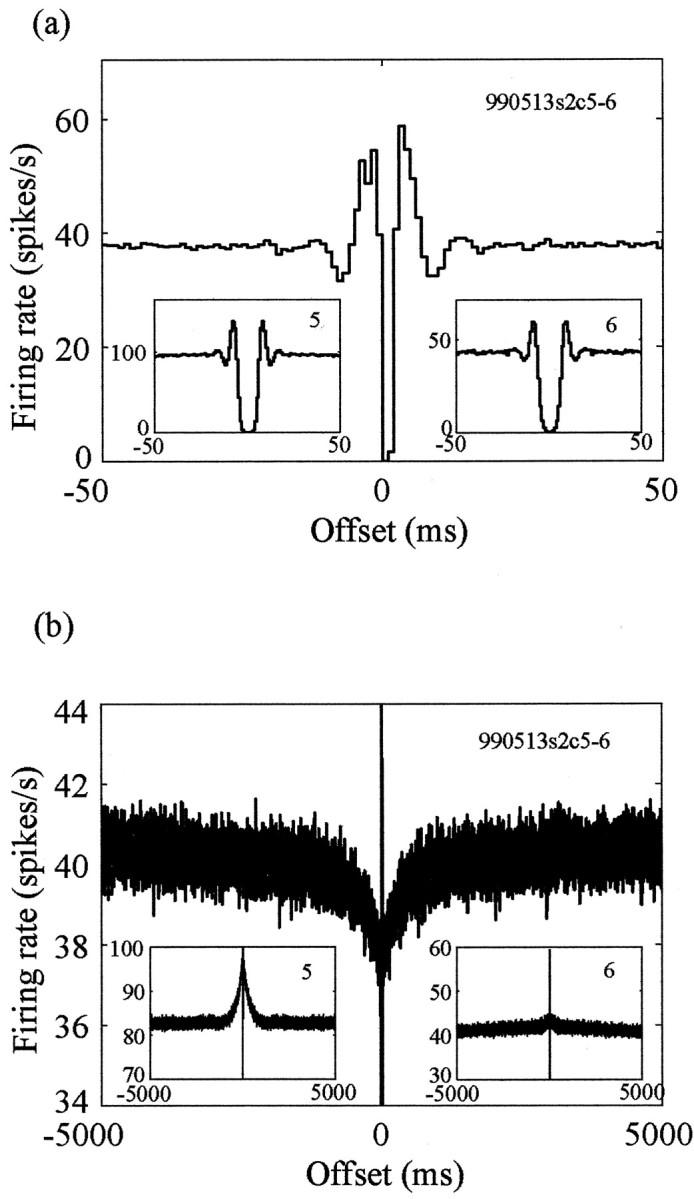
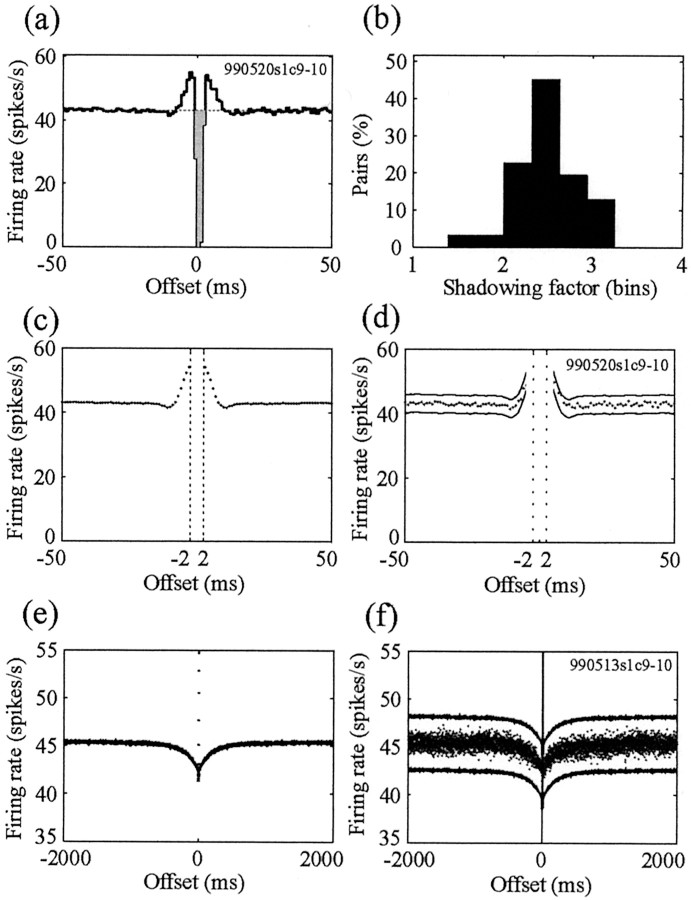
The anatomical structure of the basal ganglia displays topographical organization and massive funneling of neuronal projections toward the globus pallidus as well as an axonal collateral system within this nucleus. This structure suggests the formation of correlations between the spiking activities of pallidal cells. Nevertheless, previous studies of remote neurons in the pallidum have reported uncorrelated spiking activity. These correlation results may be challenged, because remote pallidal neurons may be located in different pallidal territories. To further test the independence of pallidal activity, we studied the spiking activity of neighboring pairs recorded by the same electrodes. A narrow peak dominated the correlations of all pairs of neurons recorded on the same electrode. This type of peak is classically interpreted as a sign of strong common input. However, recent mathematical analysis shows that such peaks may derive from a technical inability to detect overlapping spikes by spike-sorting techniques. A long-term shallow trough in the correlation of neighboring neurons may also result from the same effect, which we have termed the "shadowing effect." A comparison of the expected shadowing effect with the actual correlations suggests that no real correlations exist between 93.9% of neighboring pallidal pairs. The remaining 6.1% of the pairs display symmetric long-term positive correlations centered on time 0. Thus, functional interactions between neighboring pallidal neurons do not display any significant differences from the interactions between physically remote neurons in this brain area. Moreover, the combination of anatomical data and current physiological results suggests an active decorrelating process performed in the basal ganglia.
Figures
References
-
- Abeles M ( 1974) A journey into the brain. In: Signal analysis and pattern recognition in biomedical engineering (Inbar GF, ed), pp 41–59. New York: Wiley.
-
- Abeles M, Goldstein MHJ ( 1977) Multispike train analysis. IEEE Trans Biomed Eng 65: 762–773.
-
- Aertsen AM, Gerstein GL ( 1985) Evaluation of neuronal connectivity: sensitivity of cross-correlation. Brain Res 340: 341–354. - PubMed
-
- Alexander GE, DeLong MR, Strick PL ( 1986) Parallel organization of functionally segregated circuits linking basal ganglia and cortex. Annu Rev Neurosci 9: 357–381. - PubMed
-
- Bar-Gad I, Bergman H ( 2001) Stepping out of the box: information processing in the neural networks of the basal ganglia. Curr Opin Neurobiol 11: 689–695. - PubMed
Publication types
MeSH terms
LinkOut - more resources
Full Text Sources