. 2003 May 15;23(10):4044-53.
doi: 10.1523/JNEUROSCI.23-10-04044.2003.

The alpha-latrotoxin mutant LTXN4C enhances spontaneous and evoked transmitter release in CA3 pyramidal neurons

Affiliations

The alpha-latrotoxin mutant LTXN4C enhances spontaneous and evoked transmitter release in CA3 pyramidal neurons

Marco Capogna et al. J Neurosci. .

Abstract

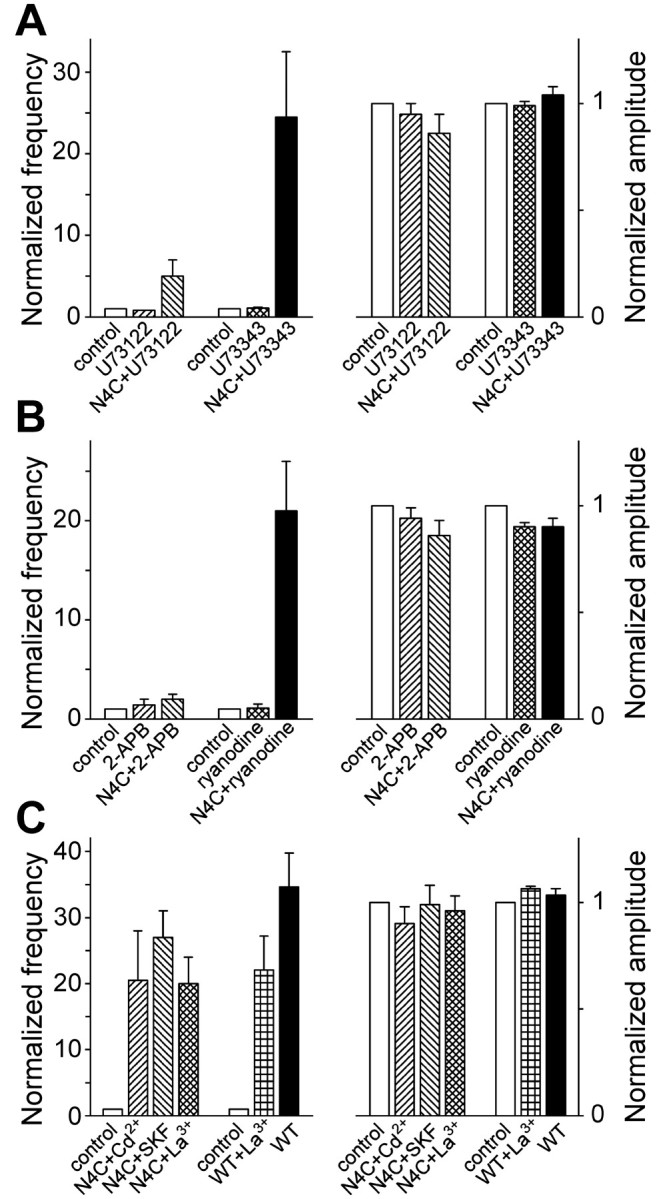
Alpha-latrotoxin (LTX) stimulates vesicular exocytosis by at least two mechanisms that include (1) receptor binding-stimulation and (2) membrane pore formation. Here, we use the toxin mutant LTX(N4C) to selectively study the receptor-mediated actions of LTX. LTX(N4C) binds to both LTX receptors (latrophilin and neurexin) and greatly enhances the frequency of spontaneous and miniature EPSCs recorded from CA3 pyramidal neurons in hippocampal slice cultures. The effect of LTX(N4C) is reversible and is not attenuated by La3+ that is known to block LTX pores. On the other hand, LTX(N4C) action, which requires extracellular Ca2+, is inhibited by thapsigargin, a drug depleting intracellular Ca2+ stores, by 2-aminoethoxydiphenyl borate, a blocker of inositol(1,4,5)-trisphosphate-induced Ca2+ release, and by U73122, a phospholipase C inhibitor. Furthermore, measurements using a fluorescent Ca2+ indicator directly demonstrate that LTX(N4C) increases presynaptic, but not dendritic, free Ca2+ concentration; this Ca2+ rise is blocked by thapsigargin, suggesting, together with electrophysiological data, that the receptor-mediated action of LTX(N4C) involves mobilization of Ca2+ from intracellular stores. Finally, in contrast to wild-type LTX, which inhibits evoked synaptic transmission probably attributable to pore formation, LTX(N4C) actually potentiates synaptic currents elicited by electrical stimulation of afferent fibers. We suggest that the mutant LTX(N4C), lacking the ionophore-like activity of wild-type LTX, activates a presynaptic receptor and stimulates Ca2+ release from intracellular stores, leading to the enhancement of synaptic vesicle exocytosis.


Figures

Figure 1.
Figure 1.
A, Immunodetection of LTX receptors in hippocampal slices. Crude brain membranes (P2) and slices were separated in 8% SDS-polyacrylamide gels either directly (0.05 mg of protein per lane) or after enrichment by LTX affinity chromatography (equivalent to 0.3 mg of starting protein per lane) and then blotted and immunostained with respective antibodies (shown on the right). B, Binding of LTXWT and LTXN4C to hippocampal slices. Top, the specific binding of 1 nm iodinated recombinant latrotoxins was determined (see Materials and Methods) in the presence of 2 mm CaCl2 or 2 mm EGTA. Bottom, Dose dependence of the specific binding of LTXWT and LTXN4C to slices in the presence of Ca2+. One homogenized slice was used per point. The data are from a typical experiment done in triplicate. C, LTXWT, but not LTXN4C, induces 45Ca2+ influx in hippocampal slice cultures. One slice was used per experimental point (see Materials and Methods), and the data are the mean of two experiments done in duplicate.
Figure 2.
Figure 2.
LTXN4C increases the frequency of spontaneous synaptic currents. A, Continuous whole-cell recordings of sEPSCs (downward peaks) and sIPSCs (upward peaks) from a CA3 pyramidal cell in a hippocampal slice culture, before and after focal application of 1 nm LTXN4C. B, Pooled data for all recorded cells: on average, sEPSC frequency rose from 1.4 ± 0.5 Hz in control to 18.3 ± 4.1 Hz in the presence of LTXN4C (n = 8; p < 0.004), and sIPSC frequency increased from 0.8 ± 0.3 to 10.3 ± 3.8 Hz (n = 6; p < 0.03), respectively. C, The frequencies and amplitudes of sEPSCs and sIPSCs normalized to control values for each cell. Note that LTXN4C causes no significant changes in the amplitudes.
Figure 3.
Figure 3.
LTXN4C increases mEPSC frequency in a reversible manner. A, Continuous whole-cell recordings of mEPSCs from a CA3 pyramidal cell in a slice culture in the presence of 1 μm TTX and 30 μm bicuculline. Focal application of 1 nm LTXN4C reversibly increased the frequency of mEPSCs (0.4 Hz for control, 18.6 Hz for LTXN4C, and 4.4 Hz for washout) but did not significantly affect their mean amplitude (18.5 pA for control, 17 pA for LTXN4C, and 18.4 pA for washout). B, Pooled data from all recorded cells: mEPSC frequency before (control), 0.5–20 min after the application of 1 nm LTXN4C or LTXWT, after a 27 ± 3 min wash, and after a second addition of 1 nm mutant. On average, mEPSC frequency was 0.5 ± 0.07 Hz in control, 8.1 ± 1.3 Hz after LTXN4C (n= 18; p < 0.001), and 0.7 ± 0.3 Hz before and 17.3 ± 3.7 Hz after LTX WT (n = 3; p < 0.01). After superfusion, it was 2.5 ± 0.4 Hz for LTXN4C (n = 12) and 18.6 ± 3.7 Hz for LTXWT (n = 3). C, Changes in the mean mEPSC frequency and amplitude induced by the recombinant toxins, normalized to the control value for each cell. Note that the effect of LTXN4C, but not LTXWT, decreases after extensive bath perfusion.
Figure 4.
Figure 4.
LTXN4C increases mEPSC frequency in a Ca2+e-dependent manner. A, Continuous recordings of mEPSCs before (1) and after the application of 1 nm LTXN4C (2) in 3 mM Ca2+-containing control saline; this was then replaced with Ca2+-free saline containing 1 mM EGTA (3) and later reintroduced again (4). B, Pooled data from all recorded cells: mEPSC frequency in control, 0.5–20 min after the application of 1 nm LTXN4C or LTXWT (as indicated) in the presence of Ca2+, and after the removal and reintroduction of Ca2+. Note that LTXWT, but not LTXN4C, increases mEPSC frequency, even in the absence of Ca2+. C, Mean mEPSC frequency and amplitude normalized to control value for each cell. LTXN4C increases mEPSC frequency in the presence (n = 5), but not the absence (n = 5), of Ca2+ and has no effect on mean mEPSC amplitude under any condition. The frequency of mEPSCs was 0.5±0.2 Hz in control,7.7±2.7 Hz after LTXN4C addition (19.2 ± 2.5-fold increase; n = 5; p < 0.05), 2.2 ± 1.3 Hz in EGTA-containing saline (4.2 ± 1.3-fold above control; n = 5; p < 0.02), and 7.2 ± 3 Hz after switching back to normal saline (20.2 ± 5.5-fold above control; n = 5).
Figure 5.
Figure 5.
The depletion of intracellular Ca2+ stores by Th blocks the increase of mEPSC frequency induced by LTXN4C. A, Continuous recordings of mEPSCs before (1) and after 10 min (2) or 30 min(3) application of Th, and 15 min after subsequent addition of LTXN4C (4). B, Pooled data from all recorded cells: mEPSC frequency in control, 10, 20, or 30 min after the superfusion with Th, and after subsequent sequential applications of LTXN4C and LTXWT. C, Mean mEPSC frequency (top) and amplitude (bottom) normalized to control value for each cell. Superfusion with Th for 10, 20, or 30 min did not significantly change mEPSC frequency (n = 9; p > 0.4) and inhibited the effect of LTXN4C (only 2.1 ± 0.5-fold increase above Th for 30 min; n = 9; p > 0.08) but did not attenuate the action of LTXWT (15.1 ± 3.2-fold increase above Th for 30 min; n = 3; p < 0.05). The latter was, however, substantially blocked after the subsequent addition of 100μm La3+ (3.1 ± 1.1-fold increase above Th for 30 min; n = 4; p > 0.1). The mean mEPSC amplitude was not altered by any of these conditions.
Figure 6.
Figure 6.
LTXN4C produces an increase in the basal Ca2+ fluorescence of CA3 pyramidal cell nerve terminals. A, Top, A length of axon from a CA3 pyramidal neuron can be visualized after injection of the calcium indicator dye Oregon Green 488 BAPTA-1. A presynaptic bouton is marked by an arrow. Note the piece of dendrite, studded with dendritic spines, at the top right corner of the image. Bottom, Fifteen minutes after the application of 1 nm LTXN4C, the basal fluorescence of the axon has increased.B, Top,Ca2+fluorescence in presynaptic boutons before and after the application of LTXN4C. Sequential frames of an axon with three boutons (numbered 1–3) were taken at indicated times; 1 nm toxin was added at 0 min. Bottom, Relative increase in fluorescence determined for boutons 1–3 above. Note that the fluorescence reaches maximal values between 10 and 15 min from toxin application but then gradually decreases to the control level. C, A summary histogram revealing that LTXN4C produces a significant increase inbasal fluorescence of the axon(n=6;p<0.03).Cells treated with 4μm Th show no increase in basal fluorescence after exposure to LTXN4C (n = 3). ns, Nonsignificant.
Figure 7.
Figure 7.
LTXN4C action involves the activation of the PLC–IP3–Ca2+ signaling cascade but not the opening of Ca2+ channels or LTX pores. A–C, Normalized mean frequency and amplitude of mEPSC evoked by LTXN4Cinhippocampal slices treated with the following: 2 μm U73122 or 2 μm U73343 (A); 50 μm 2-APB or 20 μm ryanodine (B); 50 μm SKF 96365, 100 μm Cd2+, or 100μm La3+(C).All of the data in the figure are normalized to the control value for each cell. On average, the mEPSC frequency was as follows (in Hz): controls, from 0.5 to 1.4; U73122, 0.7 ± 0.2; U73343, 0.9 ± 0.2; 2-APB, 1.7 ± 0.6; ryanodine, 1.2 ± 0.6; Cd2+, 0.7 ± 0.1; SKF 96365, 0.8 ± 0.2; La3+, 1.1 ± 0.1. Subsequently added LTXN4C increased the mEPSC frequency as follows (in Hz): control, 24 ± 3.2 (n = 8; p < 0.001); U73122, 4 ± 1 (n = 4; p < 0.05); U73343, 18.1 ± 1.8 (n = 3; p < 0.01); 2-APB, 2.1 ± 0.4 (n = 5; p > 0.7; nonsignificant); ryanodine, 21.1 ± 4.4 (n = 4; p < 0.04); Cd2+,11 ± 0.7 (n = 5; p < 0.0001; p > 0.26 compared with mEPSC frequency increase by LTXN4C in control cultures; Fig. 3C); SKF 96365, 15.3 ± 3.7 (n = 4; p < 0.03; p > 0.06 compared with data in Fig. 3C); La3+, 21.8 ± 2.9 (n = 5; p < 0.002; p < 0.001 compared with data in Fig. 3C). LTXWT increased the frequency to 14.1 ± 3.2 Hz in the presence of La3+ and 22.1 ± 1.6 Hz after the removal of La3+ (n = 4; p<0.02 andp<0.0009, respectively).The toxins had no effect on the mean mEPSC amplitude under any condition. Note that 2-APB significantly reduces and U73122 inhibits the effect of LTXN4C, whereas La 3+ attenuates the activity of LTXWT but does not affect LTX N4C.
Figure 8.
Figure 8.
Effects of LTXN4C on evoked EPSCs. A, Single traces of EPSCs evoked in a CA3 neuron by pairs of stimuli in the dentate gyrus (interval between stimuli, 50 msec) before and after LTXN4C application. The mutant toxin reversibly enhanced the amplitude of evoked EPSCs. The mean values for this cell were as follows: control, EPSC1, 69 ± 2 pA; control, EPSC2, 72 ± 3 pA; LTXN4C, EPSC1, 98 ± 28 pA; LTXN4C, EPSC2, 86 ± 32 pA; wash, EPSC1, 69 ± 6 pA; wash, EPSC2, 68 ± 7 pA. B, The time course of the LTXN4C effect on the amplitude of EPSCs evoked by the first stimuli in the same cell. After LTXN4C addition (arrow), some inward currents elicited peak-saturated voltage-clamp-recorded action potentials (more than -200 pA; labeled as action currents). C, Pooled data, Peak amplitudes of evoked EPSCs (eEPSCs) in control, after the addition and washout of LTXN4C, and after the addition of LTXWT. On average, the amplitude of the EPSCs was 41 ± 7 pA before and 58 ± 11 pA after LTXN4C and 41 ± 9 pA after washing out (n = 5; but n = 4 washed); it was 105 ± 14 pA before and 63 ± 12 pA after LTXWT (n = 3). D, EPSC peak amplitudes and 1/CV2 values normalized to the control value for each cell. LTXN4C enhanced EPSC amplitudes and depressed 1/CV2 (n = 5). EPSC amplitudes fully recovered on LTXN4C washout, whereas 1/CV2 recovered only partially (n = 5). In contrast, LTXWT decreased EPSC peak amplitudes but also caused a higher variability of neuronal responses.

References

    1. Ashton AC, Rahman MA, Volynski KE, Manser C, Orlova EV, Matsushita H, Davletov BA, van Heel M, Grishin EV, Ushkaryov YA ( 2000) Tetramerisation of α-latrotoxin by divalent cations is responsible for toxin-induced non-vesicular release and contributes to the Ca2+-dependent vesicular exocytosis from synaptosomes. Biochimie 82: 453–468. - PubMed
    1. Ashton AC, Volynski KE, Lelianova VG, Orlova EV, Van Renterghem C, Canepari M, Seagar M, Ushkaryov YA ( 2001) α-Latrotoxin, acting via two Ca2+-dependent pathways, triggers exocytosis of two pools of synaptic vesicles. J Biol Chem 276: 44695–44703. - PubMed
    1. Bittner MA, Krasnoperov VG, Stuenkel EL, Petrenko AG, Holz RW ( 1998) A Ca2+-independent receptor for α-latrotoxin, CIRL, mediates effects on secretion via multiple mechanisms. J Neurosci 18: 2914–2922. - PMC - PubMed
    1. Capogna M, Gähwiler BH, Thompson SM ( 1996a) Presynaptic inhibition of calcium-dependent and -independent release elicited with ionomycin, gadolinium, and α-latrotoxin in the hippocampus. J Neurophysiol 75: 2017–2028. - PubMed
    1. Capogna M, Gähwiler BH, Thompson SM ( 1996b) Calcium-independent actions of α-latrotoxin on spontaneous and evoked synaptic transmission in the hippocampus. J Neurophysiol 76: 3149–3158. - PubMed

Publication types

MeSH terms

LinkOut - more resources