. 2003 May 15;23(10):4134-45.
doi: 10.1523/JNEUROSCI.23-10-04134.2003.

Expression and function of chloride transporters during development of inhibitory neurotransmission in the auditory brainstem

Affiliations

Expression and function of chloride transporters during development of inhibitory neurotransmission in the auditory brainstem

Veeramuthu Balakrishnan et al. J Neurosci. .

Abstract

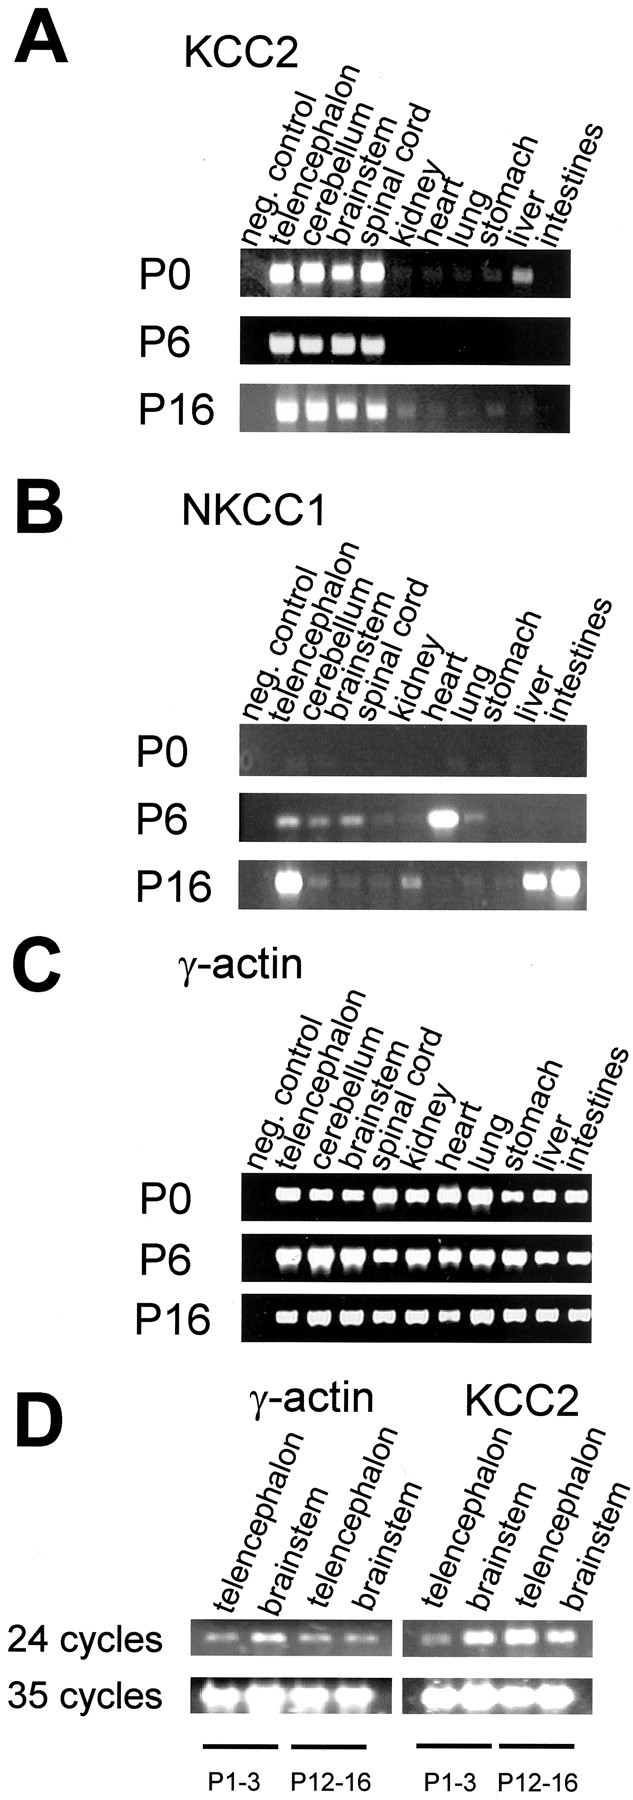
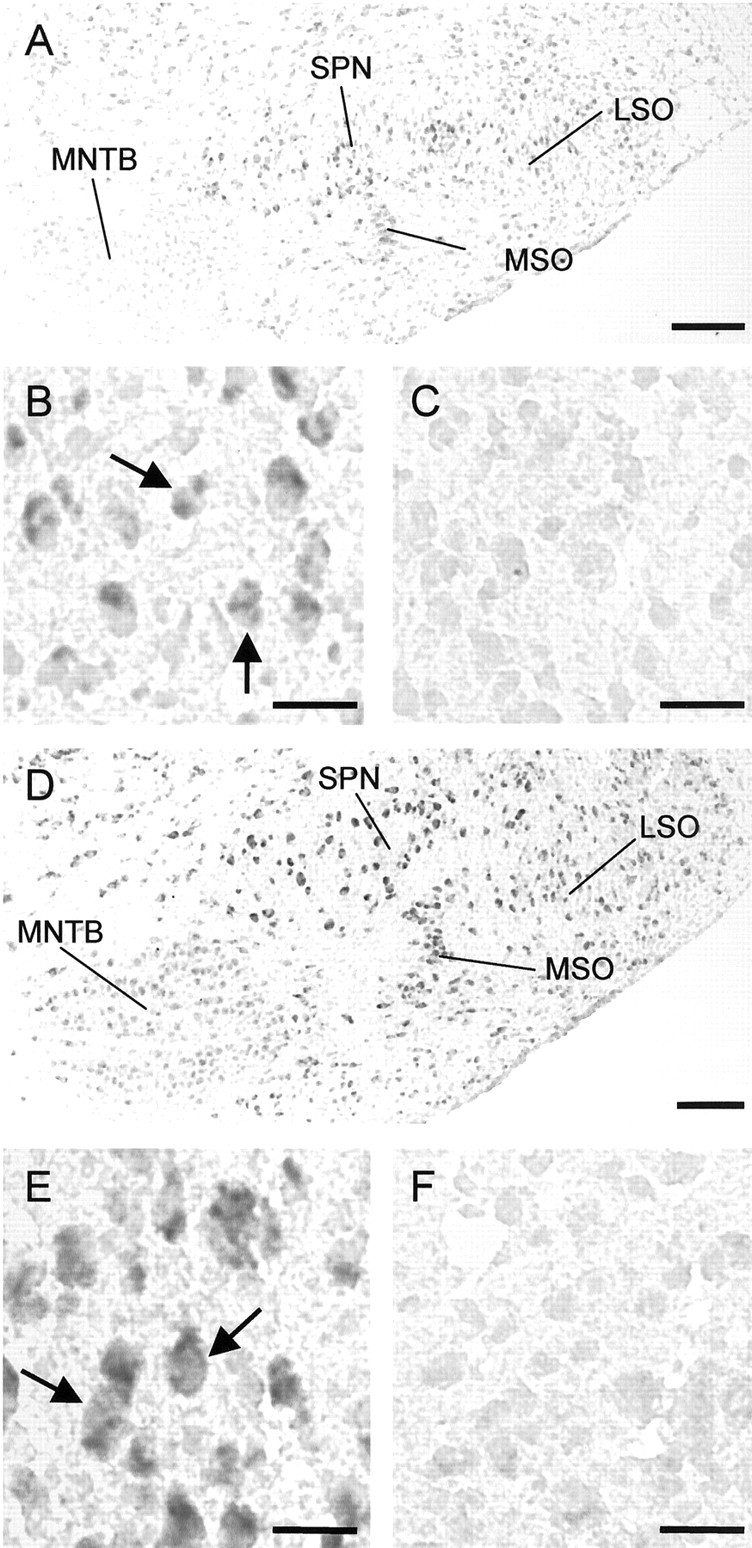
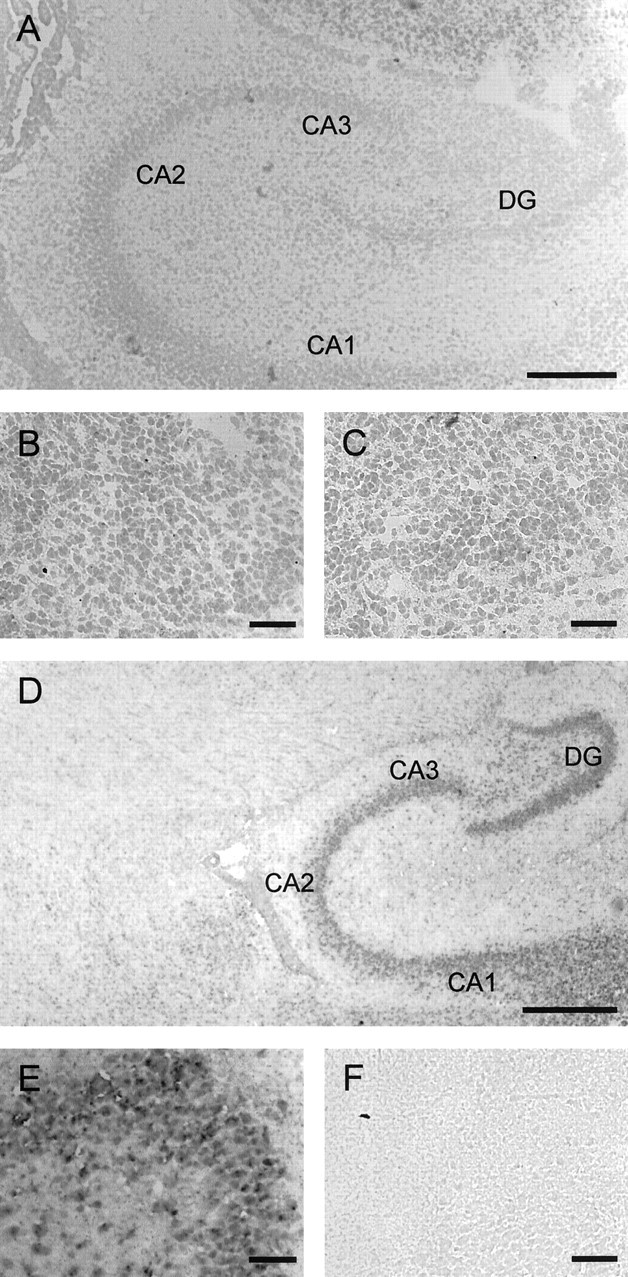
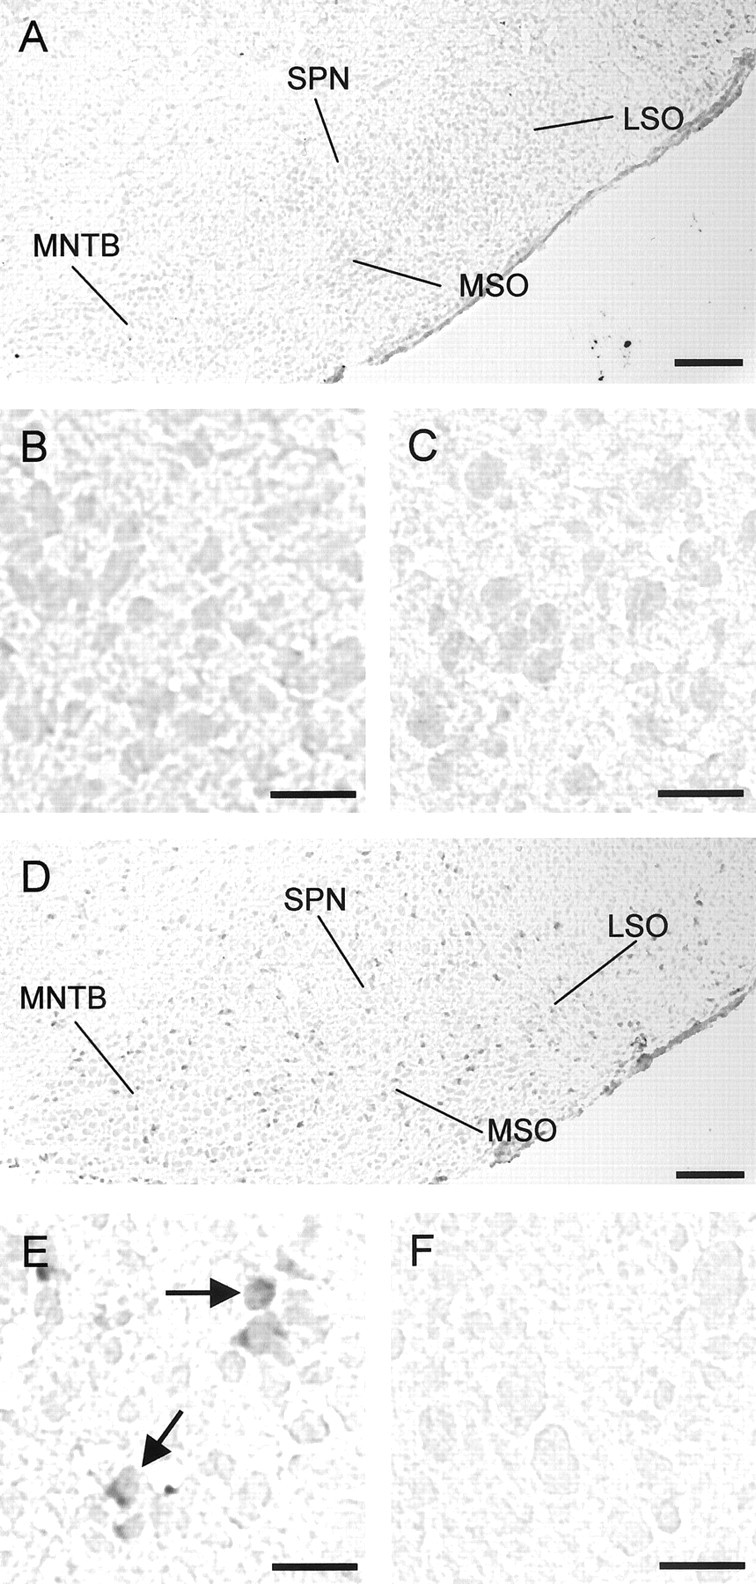
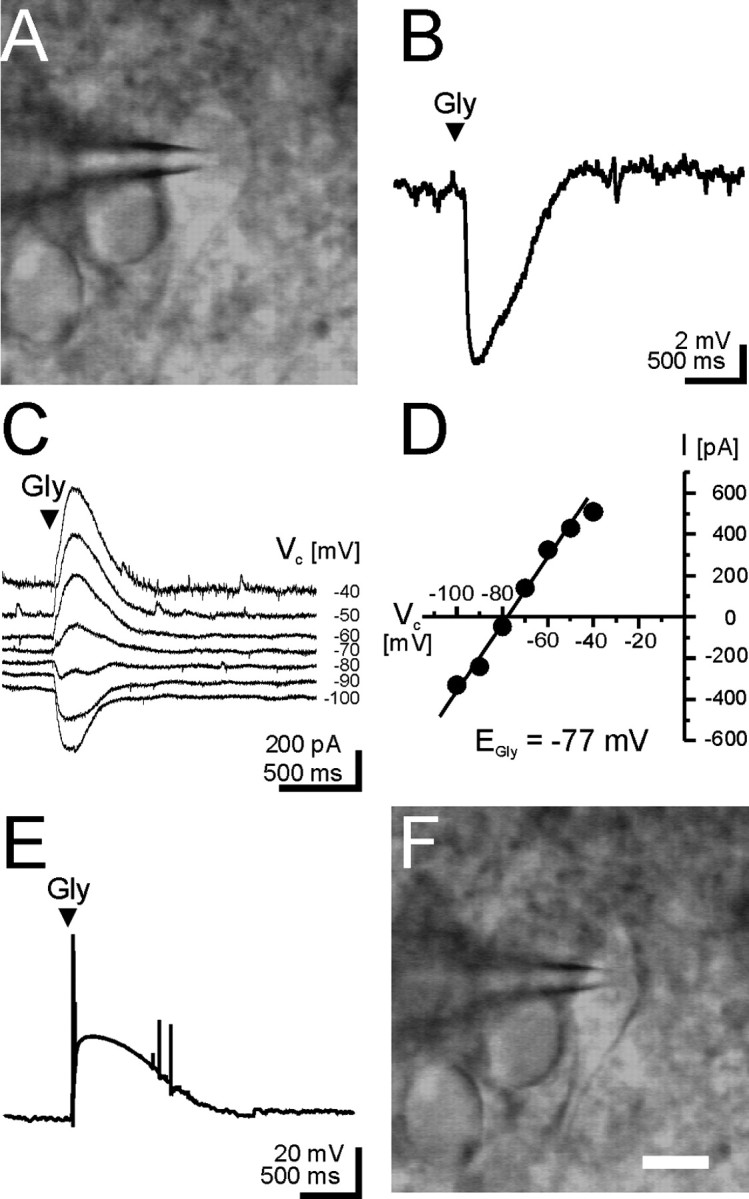
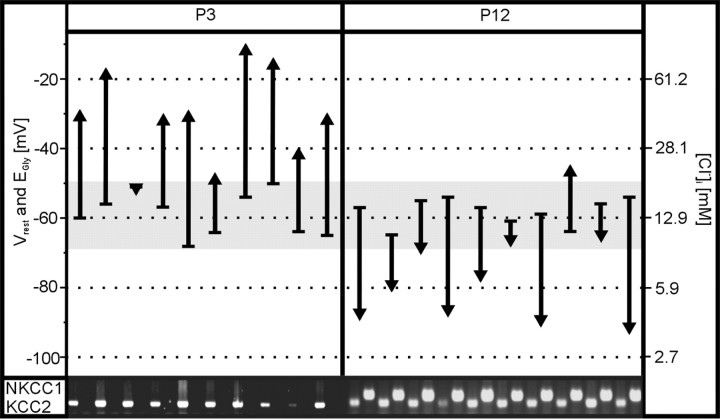
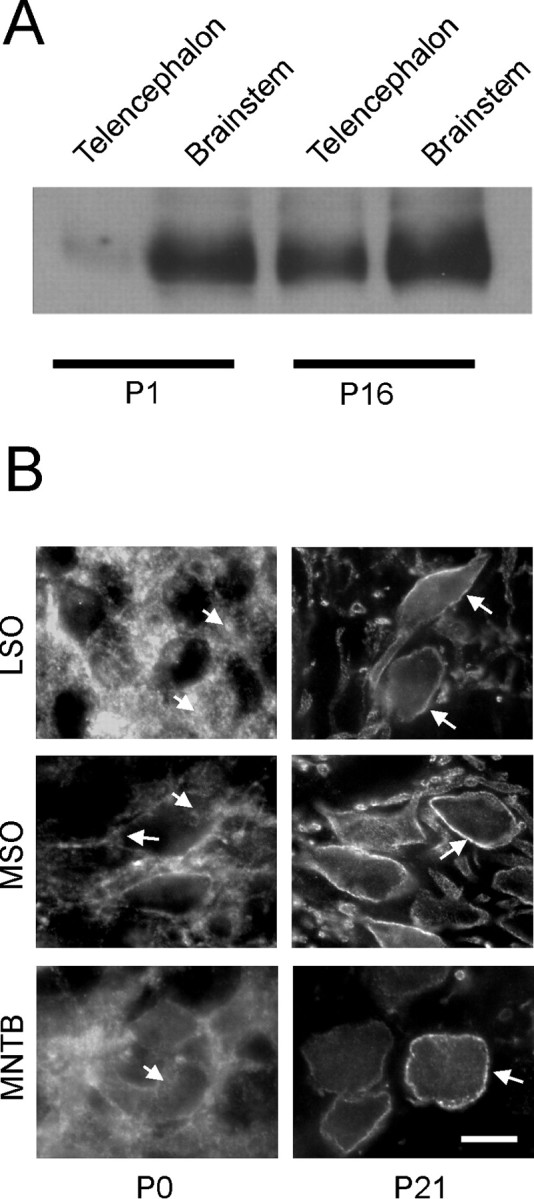
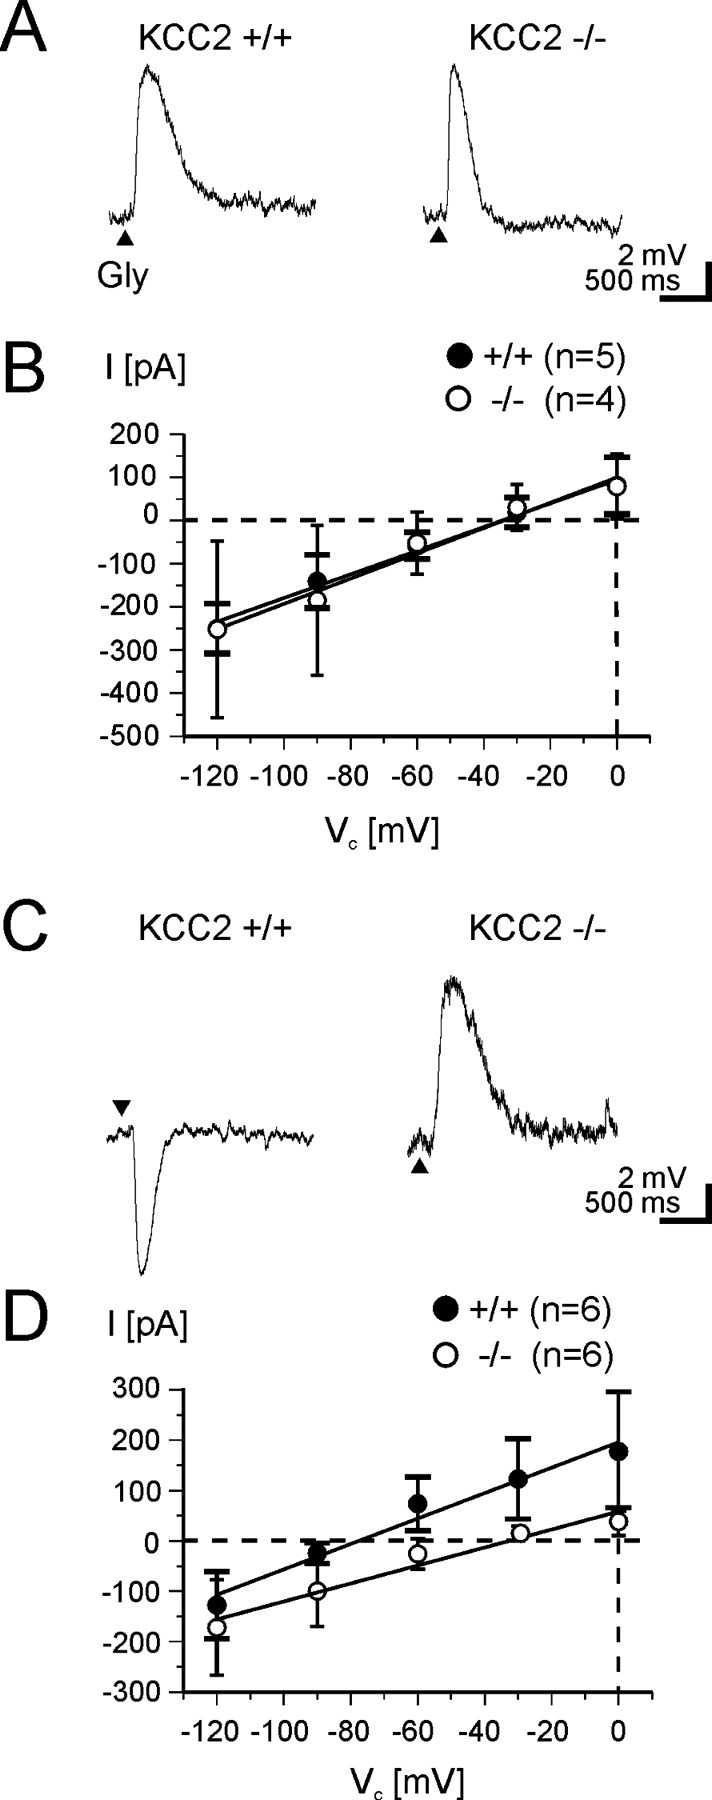
Glycine and GABA, the dominant inhibitory neurotransmitters in the CNS, assume a depolarizing role in early development, leading to increased cytoplasmic Ca2+ levels and action potentials. The effect is thought to be of some significance for maturation. The depolarization is caused by Cl- efflux, and chloride transporters contribute to the phenomenon by raising the intracellular Cl- concentration ([Cl-]i) above equilibrium, thereby generating an outward-directed electrochemical gradient for Cl-. In mature neurons, the [Cl-]i is reduced below equilibrium, thus rendering glycine activity hyperpolarizing. Here, we investigated the temporal expression of the K-Cl cotransporter KCC2 and the Na-K-Cl cotransporter NKCC1 in the lateral superior olive (LSO) of rats and mice. The two cation cotransporters normally extrude and accumulate Cl-, respectively. As evidenced by several methods, KCC2 mRNA was present in LSO neurons during both the depolarizing and hyperpolarizing periods. Western blots confirmed a constant level of KCC2 in the brainstem, and immunohistochemistry showed that the protein is diffusely distributed within neonatal LSO neurons, becoming integrated into the plasma membrane only with increasing age. The glycine reversal potential in KCC2 knock-out mice differed significantly from that determined in wild-type controls at postnatal day 12 (P12) but not at P3, demonstrating that KCC2 is not active in neonates, despite its early presence. NKCC1 mRNA was not detected during the depolarizing phase in the LSO, implying that this transporter does not contribute to the high [Cl-]i. Our results reveal major differences in the development of [Cl-]i regulation mechanisms seen in brainstem versus forebrain regions.


Figures

Figure 1.
Figure 1.
Development of KCC2 and NKCC1 expression in rat tissues. RT-PCR was performed on 10 tissues and at three postnatal ages. A, KCC2 expression was restricted to all neural tissues (telencephalon, cerebellum, brainstem, and spinal cord), confirming the neuron specificity of KCC2 (Lauf and Adragna, 2000).The only exception is provided by the liver, which shows a signal at P0 but becomes devoid at older ages. B, In none of the tissues analyzed was an NKCC1 signal seen at P0. At P6 and P16, a signal was obvious in most tissues, although generally at a low level. Note the higher expression levels in the heart (P6), telencephalon, liver, and intestines (P16). In the brainstem, NKCC1 mRNA was barely detectable. C, Analysis of γ-actin mRNA (positive control) shows uniform bands in all samples, implying equal amounts of cDNA after the RT-PCR reactions. When cDNA was replaced by H2O (negative control), no amplification product became visible (A–C). D, A high number of 35 PCR amplification cycles resulted in saturating concentrations of the PCR products and, therefore, showed a strong signal even at P1–P3 when the expression level of KCC2 is low (compare with Fig. 2). When the number of cycles was reduced to 24, the telencephalic signal obtained at P1 was considerably weaker than that obtained at P16, demonstrating upregulation in this brain region with age. In contrast, with the same 24 cycles, similarly strong signals are found in the brainstem during development.
Figure 2.
Figure 2.
Expression of KCC2 mRNA in the developing rat superior olivary complex. Coronal sections were hybridized with digoxigenin-labeled KCC2-specific riboprobes using standard in situ hybridization protocols. A–C, At P3, labeling is already present in the LSO (B, arrows), the MSO, and the SPN. Neurons in the MNTB are barely labeled. B (antisense probe) and C (sense probe) show part of the LSO at high magnification. At P12 (D–F), the labeling pattern is virtually unchanged, except that MNTB neurons appear to be more heavily labeled now. E (antisense probe) and F (sense probe) show part of the LSO at high magnification. In the LSO, the density of labeled neurons (E, arrows) has not increased compared with P3 (19 at P12 vs 17 at P3 in B and E, respectively), indicating that there is no upregulation of KCC2 during the period when the switch to hyperpolarization occurs. Dorsal is to the top, and lateral to the right. Scale bars: A, D, 200 μm; B, C, E, F, 25 μm.
Figure 3.
Figure 3.
Upregulation of KCC2 gene expression in the hippocampus revealed by in situ hybridization. A–C, At P0, all hippocampal areas [i.e., CA1–CA3 and dentate gyrus (DG)] are almost devoid of labeling; however, note some labeling in the cortex dorsal to the CA3 region. D–F, At P16, labeling is clearly present in the hippocampal areas. B and E depict dentate gyrus areas from A and D at high magnification; C and F show control sections (dentate gyrus areas) labeled with sense probe. Sagittal sections, Dorsal is to the top, and caudal is to the right. Scale bars: A, 250 μm; D, 500 μm; B, C, E, F, 50 μm.
Figure 4.
Figure 4.
Expression of NKCC1 mRNA in the developing rat superior olivary complex revealed by in situ hybridization. A, At P3, none of the SOC nuclei contains labeled cells. B, All LSO cells are clearly unlabeled at that age. C, Control section (LSO) labeled with sense probe. D, At P12, sporadic labeling is seen in all SOC nuclei, including the LSO (E, arrows), indicating that NKCC1 expression is at best upregulated with age. F, Control section (LSO) labeled with sense probe. Coronal sections, Dorsal is to the top, and lateral is to the right. Scale bars: A, D, 200μm; B, C, E, F, 25 μm.
Figure 5.
Figure 5.
Example of a single-cell RT-PCR experiment performed on LSO neurons. Patch-clamp recordings in the perforated mode with gramicidin as the ionophore were obtained from a P12 neuron with spindle-shaped soma (A). Hyperpolarizing voltage changes of approximately −8 mV were elicited during glycine application (Gly; arrowhead) when recording in the current-clamp configuration (B). C, D, EGly was determined during voltage-clamp recordings at seven different holding potentials (−100 to −40 mV; see Materials and Methods) and found to be −77 mV (resting membrane potential was −57 mV). After the rupture of patch membrane, thereby going into whole-cell mode, glycine application rapidly elicited depolarizing voltage changes of ∼40 mV (E), indicating fast dialysis of the interior of the neuron. The depolarization caused the cell to fire few action potentials, demonstrating the excitatory effect of glycine. The cell content was harvested into the recording pipette under visual control (F), followed by a nested RT-PCR.
Figure 6.
Figure 6.
Relationship between EGly and the presence of KCC2 and NKCC1 transcripts in individual LSO neurons at P3 and P12. This figure illustrates the difference between Vrest (base of arrow) and EGly (tip of arrow) determined in 20 neurons. EGly was more positive than Vrest (EGly > Vrest) in 9 of 10 neurons at P3 (upward arrows), whereas EGly < Vrest in 9 of 10 neurons at P12 (downward arrows). Values for intracellular chloride concentration ([Cl]i) were calculated with the Nernst equation and are shown on the right. The gray band illustrates the range for Vrest (−50 to −68 mV). Vrest averaged −59 ± 6 mV at P3 (mean ± SD) and did not differ from Vrest at P12 (−58 ± 4 mV; p = 0.77). In contrast, EGly at P3 (mean, −32 ± 13 mV; range, −12 to −52 mV) became significantly more negative until P12 (mean, −76 ± 14 mV; range, −47 to −92 mV; p < 103). Whereas [Cl]i averaged 44 ± 22 mM at P3, it amounted to 8 ± 5 mV by P12 [i.e., it was significantly lower, p < 103, having declined by ∼80% within 10 d, to the same degree as described in the hypothalamus (Gao and van den Pol, 2001)]. The results from the single-cell RT-PCR experiments are depicted in the bottom part of the figure. Every neuron analyzed was positive for KCC2 mRNA, regardless of age. In contrast, no NKCC1 transcript was detected in the P3 group, whereas it was present in every neuron at P12.
Figure 7.
Figure 7.
Analysis of KCC2 expression at the protein level. A, Western blot showing developmental upregulation of the KCC2 protein in the telencephalon but not in the brainstem. B, Immunohistochemical staining of rat LSO, MSO, and MNTB neurons, showing diffuse intracellular labeling pattern at P0 (arrows). In contrast, a concentration of the signal in the plasma membrane surrounding the somata and proximal dendrites is obvious at P21 (arrows). Note that MSO neurons display some signal in the plasma membrane already at P0. Scale bar, 10μm in all photomicrographs.
Figure 8.
Figure 8.
AD,EGly in LSO neurons of KCC2 −/− mice (open circles) at P3 (A, B) and P12 (C, D) compared with wild-type mice (filled circles). Arrowheads in A and C indicate glycine application. Typical examples of glycine-induced voltage changes obtained in current-clamp recordings at P3 (A) and P12 (C). Depolarizing responses are present in both +/+ and −/− mice at P3 and also in −/− mice at P12. Vrest does not differ considerably among the neurons (P3 +/+, −58 mV; P3 −/−, −60 mV; P12 +/+, −58 mV; P12 −/−, −62 mV). B, D, Current–voltage relationships demonstrate an abnormally positive EGly of −33 ± 7 mV in −/− mice at P12. Error bars illustrate SD (long horizontal endings apply for +/+, short endings for −/− mice).

Similar articles

Cited by

References

    1. Alvarez-Leefmans FJ ( 2001) Intracellular chloride regulation. In: Cell physiology sourcebook: a molecular approach (Sperelakis N, ed), pp 301–318. San Diego: Academic.
    1. Avoli M, Luvel J, Kurcewicz I, Pumain R, Barbarosie M ( 1996) Extracellular free potassium and calcium during synchronous activity induced by 4-aminopyridine in the juvenile rat hippocampus. J Physiol (Lond) 493: 707–717. - PMC - PubMed
    1. Barker JL, Behar T, Li YX, Liu QY, Ma W, Maric D, Maric I, Schaffner AE, Serafini R, Smith SV, Somogyi R, Vautrin JY, Wen XL, Xian H ( 1998) GABAergic cells and signals in CNS development. Perspect Dev Neurobiol 5: 305–322. - PubMed
    1. Becker M, Nothwang HG, Friauf E ( 2003) Differential expression pattern of chloride transporters NCC, NKCC2, KCC1, KCC3, KCC4, and AE3 in the developing rat auditory brainstem. Cell Tiss Res, in press. - PubMed
    1. Behar TN, Li YX, Tran HT, Ma W, Dunlap V, Scott C, Barker JL ( 1996) GABA stimulates chemotaxis and chemokinesis of embryonic cortical neurons via calcium-dependent mechanisms. J Neurosci 16: 1808–1818. - PMC - PubMed

Publication types

MeSH terms