. 2003 May 15;23(10):4199-207.
doi: 10.1523/JNEUROSCI.23-10-04199.2003.

Location and size of dopaminergic and serotonergic cell populations are controlled by the position of the midbrain-hindbrain organizer

Affiliations

Location and size of dopaminergic and serotonergic cell populations are controlled by the position of the midbrain-hindbrain organizer

Claude Brodski et al. J Neurosci. .

Abstract

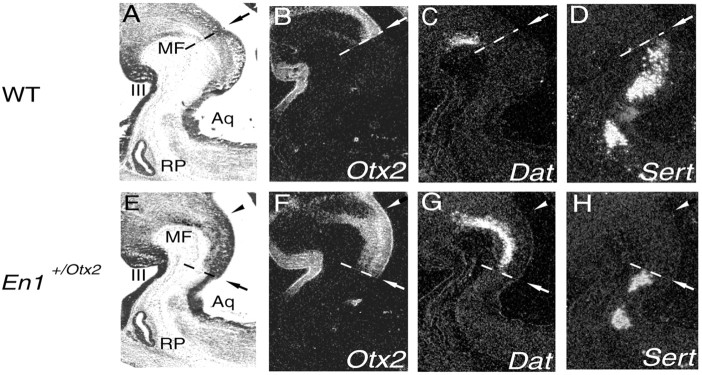
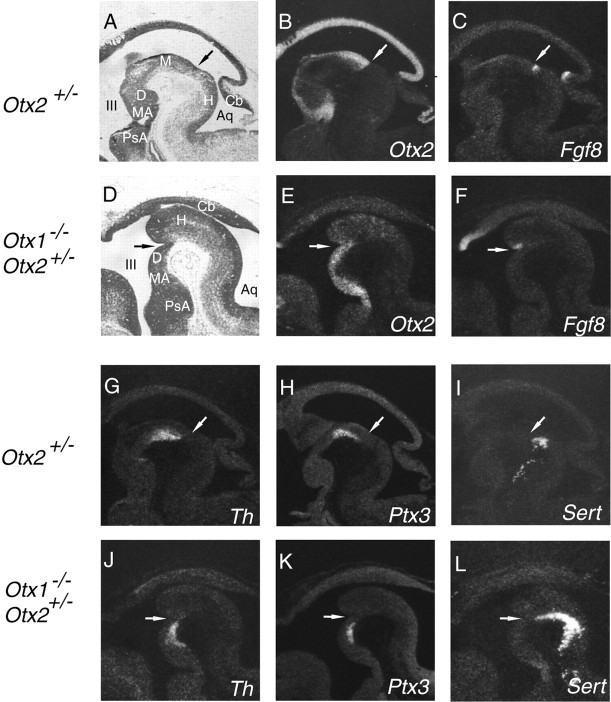
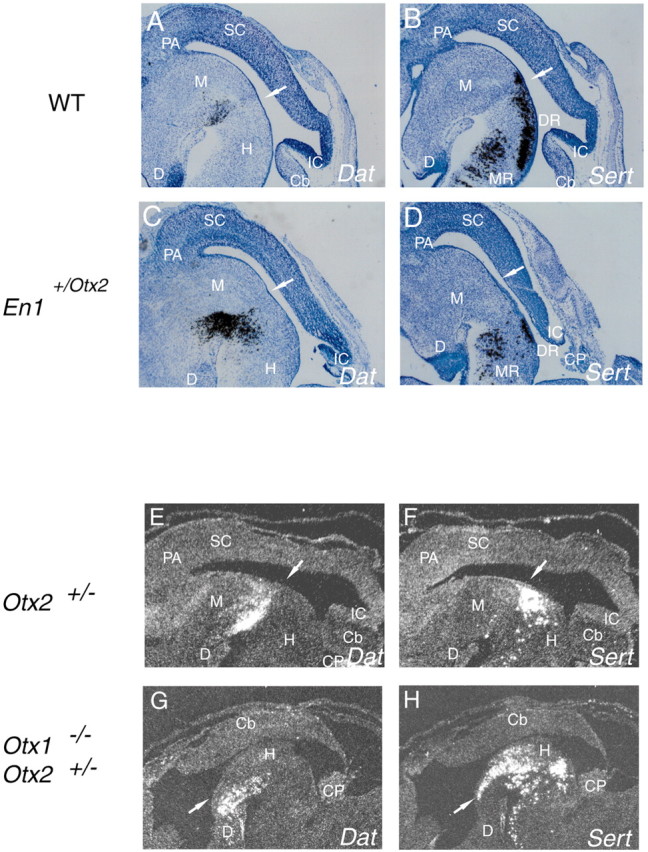
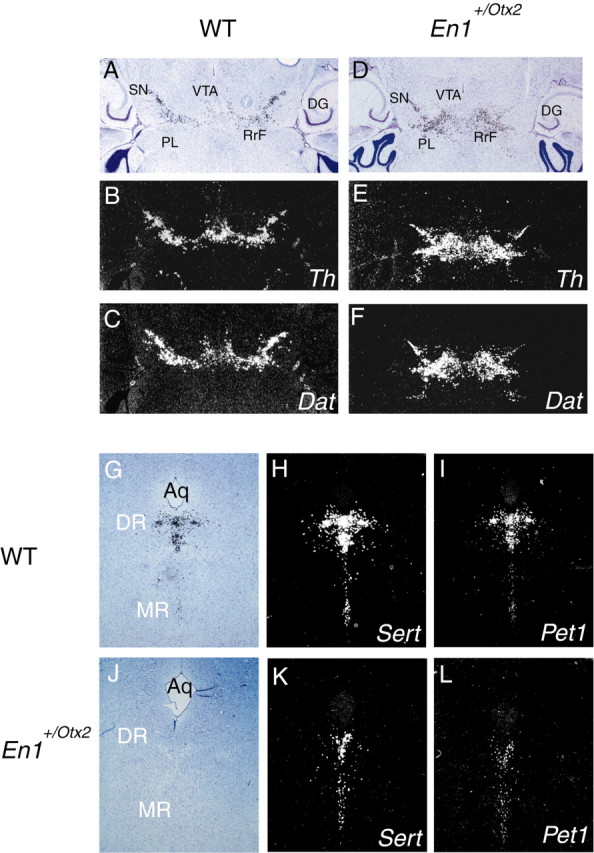
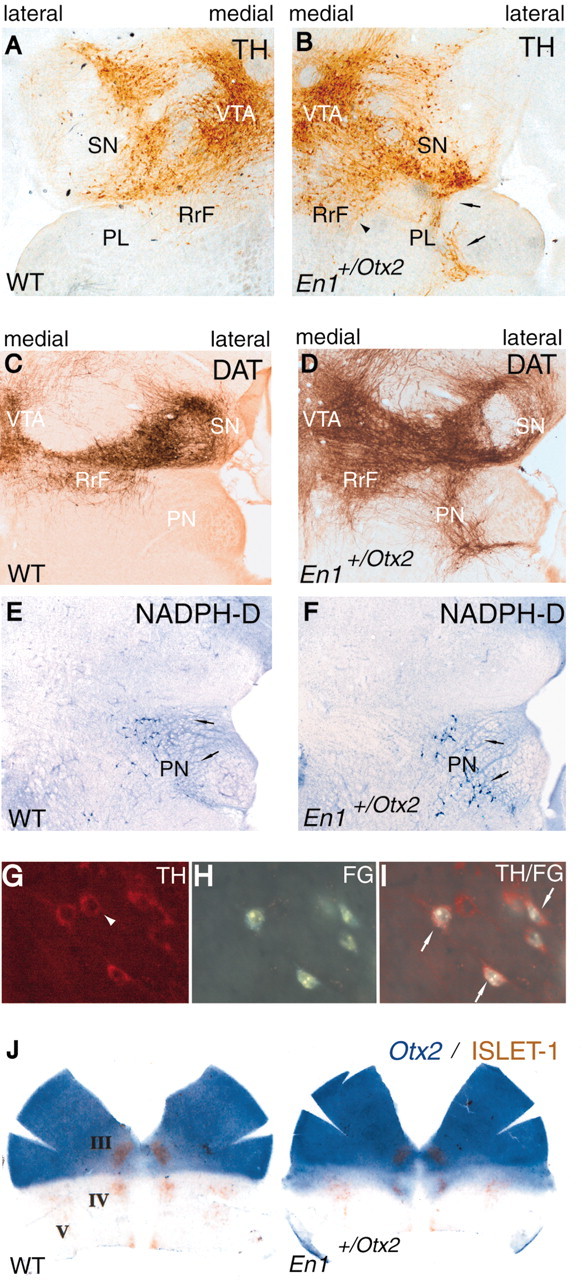
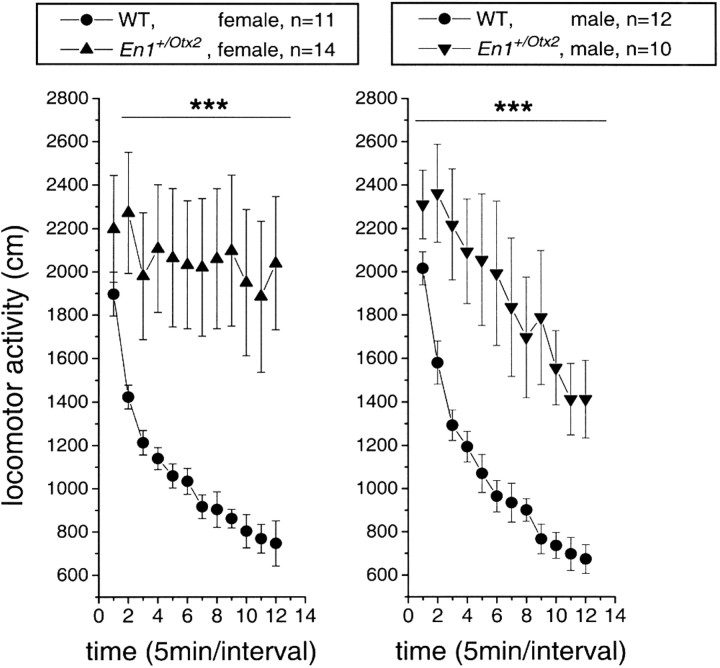
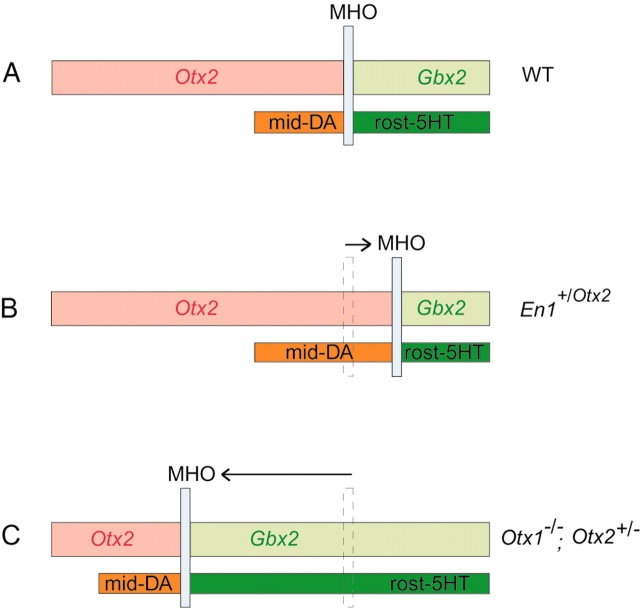
Midbrain dopaminergic and hindbrain serotonergic neurons play an important role in the modulation of behavior and are involved in a series of neuropsychiatric disorders. Despite the importance of these cells, little is known about the molecular mechanisms governing their development. During embryogenesis, midbrain dopaminergic neurons are specified rostral to the midbrain-hindbrain organizer (MHO), and hindbrain serotonergic neurons are specified caudal to it. We report that in transgenic mice in which Otx2 and accordingly the MHO are shifted caudally, the midbrain dopaminergic neuronal population expands to the ectopically positioned MHO and is enlarged. Complementary, the extension of the hindbrain serotonergic cell group is decreased. These changes are preserved in adulthood, and the additional, ectopic dopaminergic neurons project to the striatum, which is a proper dopaminergic target area. In addition, in mutants in which Otx2 and the MHO are shifted rostrally, dopaminergic and serotonergic neurons are relocated at the newly positioned MHO. However, in these mice, the size ratio between these two cell populations is changed in favor of the serotonergic cell population. To investigate whether the position of the MHO during embryogenesis is also of functional relevance for adult behavior, we tested mice with a caudally shifted MHO and report that these mutants show a higher locomotor activity. Together, we provide evidence that the position of the MHO determines the location and size of midbrain dopaminergic and hindbrain serotonergic cell populations in vivo. In addition, our data suggest that the position of the MHO during embryogenesis can modulate adult locomotor activity.


Figures

Figure 1.
Figure 1.
Shifting the MHO caudally in En1+/Otx2 mutants enlarges the mid-DA neuronal population and decreases the rost-5-HT cell group. mRNA insituhybridization on consecutive sagittal sections of E12.5 wild-type (WT;A–D)and En1+/Otx2transgenic embryos (E–H) is shown. A, E, Bright-field images. B–D, F–H, Dark-field images of adjacent sections. B, F, The caudal limit of Otx2 expression marks the position of MHO (arrows). C, Wild-type mid-DA cells, marked by Dat expression, are located rostral to the MHO. D, Rost-5-HT cells, identified by Sert, are located caudal to the MHO. F–H, Shifting the MHO caudally in En1+/Otx2 littermates (F) leads to an enlargement of the mid-DA cell population (G), whereas the rost-5-HT neuronal population (H) is complementary decreased. Each arrowhead indicates the original position of the MHO. MF, Mesencephalic flexure; III, third ventricle; Aq, Aqueduct; RP, Rathke's pouch.
Figure 2.
Figure 2.
Shifting the MHO rostrally in Otx1/; Otx2+/ mutants relocates DA cells and enlarges the rost-5-HT neuronal population. mRNA in situ hybridization on consecutive sagittal sections of E12.5 Otx2+/ (phenotypically wild type) (A–C, G–I) and Otx1/; Otx2+/ (D–F, J–L) mutant embryos. In Otx1/; Otx2+/ mutants, the midbrain is missing and the enlarged hindbrain abuts the diencephalon (Acampora et al., 1997; Suda et al., 1997). A, D, Bright-field images. The MHO is defined by the caudal expression limit of Otx2 (B, E) and by Fgf8 expression (C, F) and is shifted rostrally in Otx1/; Otx2+/ mutants (E, F). G, J, H, K, Mid-DA neurons marked by Th and Ptx3 are shifted rostrally to the ectopic MHO in mutant embryos. I, L, The rost-5-HT population, detected by Sert expression, extends in these mutants up to the ectopic MHO and is thus enlarged. Each arrow indicates the position of the MHO. III, Third ventricle; Aq, Aqueduct; Cb, cerebellum; D, ventral diencephalon; H, ventral hindbrain; M, ventral midbrain; MA, mammillary area; PsA, Postoptic area.
Figure 3.
Figure 3.
Changes in DA and 5-HT cell populations persist into later embryonic stages. mRNA in situ hybridization on consecutive sagittal sections of wild-type (WT) mice (A, B) and their En1+/Otx2 littermates (C, D) at E15.5 is shown. A, C, Shifting the MHO caudally leads to an enlargement of the DA cell population marked by Dat expression. B, D, The rost-5-HT neuronal population characterized by Sert mRNA is reduced in the mutants. The DR is more affected than the MR. E–H, mRNA in situ hybridization of consecutive sagittal sections of E15.5 Otx2+/ embryos (phenotypically wild type) and Otx1/; Otx2+/ mutants. In Otx1/; Otx2+/ mutants in which the MHO is shifted rostrally, a population of Dat-expressing cells can still be found at an ectopic position in the ventral diencephalon (E, G), and the rost-5-HT cell population is expanded up to the caudal limit of the diencephalon and enlarged (F, H). Each arrow indicates residual of isthmic fossa. Cb, Cerebellum; CP, choroid plexus; D, ventral diencephalon; M, ventral midbrain; H, ventral hindbrain; IC, inferior colliculus; SC, superior colliculus; PA, pretectal area.
Figure 4.
Figure 4.
Alterations in En1+/Otx2 mutants are maintained in adulthood. mRNA in situ hybridization on consecutive sections of adult wild-type (WT) mice (A–C, G–I) and En1+/Otx2 mutants (D–F, J–L). A–F, horizontal sections. A, D, Bright-field image of Dat. B, C, E, F, Dark-field image of Th and Dat. Both expression domains mark the substantia nigra, ventral tegmental area, and retrorubral field. DA markers are found more caudally in adult En1+/Otx2 mice compared with wild-type mice. G–L, Coronal sections (anteroposterior level: Bregma, −4.36 mm). G, J, Bright-field image of same slide as the dark-field image of Sert shown in H and K). En1+/Otx2 mutants (J–L) show reduced Sert and Pet1 expression compared with wild types (G–I), predominantly in the DR.Aq, Aqueduct; DG, dentate gyrus.
Figure 5.
Figure 5.
Ventral midbrain–hindbrain structures and projections of ectopic dopaminergic neurons in En1+/Otx2 mutants. A, B, TH immunohistochemistry on horizontal sections. Shown here is the left half of the ventral midbrain–hindbrain region of adult wild-type (WT) mice (A) and the right half of the ventral midbrain–hindbrain region of adult En1+/Otx2 mice (B). Ectopic TH-positive neurons are located caudally to the RrF (arrowhead) and SN (arrows). The latter are located in the PL. C, D, DAT immunohistochemistry marking dopaminergic neurons. E, F, NADPH–diaphorase histochemistry identifying the pedunculopontine nucleus (PN) on horizontal sections. Shown here are the right halves of the ventral midbrain–hindbrain region of adult mice. D, F, Adjacent sections of DAT and NADPH–diaphorase (NADPH-D) staining demonstrating the presence of the pedunculopontine nucleus around the ectopic DA neurons and indicating the preserved hindbrain identity of the tissue surrounding the ectopic cells. G–I, Cells in the PL of En1+/Otx2 mutants. G, TH-positive neurons in the PL. H, After an injection of FG into the striatum, retrograde labeled cells are found in the PL. I, Overlay image showing that most TH-positive cells are retrogradely labeled (arrows). However, some TH-positive neurons were not (arrowhead). J, Dorsally opened and flattened anterior neural tube of E10.5 embryos. Double labeling with Otx2 whole-mount in situ hybridization and Islet-1 immunohistochemistry, marking the cranial nerves III, IV, and V. The nucleus occulomotorius (III) is not expanded to the caudal Otx2 border and enlarged, as is the case for the dopaminergic neuronal population (compare Fig. 1C, G). In addition the nuclei trochlearis (IV) and trigeminalis (V) are not altered, corresponding to the change in the rost-5-HT cell group (compare Fig. 1 D, H).
Figure 6.
Figure 6.
En1+/Otx2 mutants are hyperactive. Locomotor activity of En1+/Otx2 mice in an open field is shown. En1+/Otx2mice and their wild-type (WT)littermates were placed in an open field, and locomotor activity was monitored by video-tracking. En1+/Otx2 mice showed enhanced locomotor activity (factor genotype, ***p < 0.00001) independent of gender (p = 0.57).
Figure 7.
Figure 7.
Influence of the position of the MHO on mid-DA and rost-5-HT cell populations. A, Mid-DA neurons develop rostral to the MHO in the Otx2 domain, and rost-5-HT cells develop caudal to it in the Gbx2 expression region. B, In En1+/Otx2 mutants, Otx2 and subsequently the MHO is shifted caudally (Broccoli et al., 1999) within the designated rost-5-HT region into rh1. This leads to an increase in the area of the mid-DA neuronal population and to a complementary decrease in the rost-5-HT cell group, indicating that the position of the MHO determines the size ratio between these two cell populations. C, In Otx1/; Otx2+/ mutants, the reduced OTX protein levels induce a shift of the MHO (Acampora et al., 1997; Suda et al., 1997) rostral to the designated mid-DA region between p2 and p3 of the forebrain. Mid-DA neurons are induced rostral to the ectopically positioned MHO, and the rost-5-HT cell population is enlarged. This suggests that the MHO is sufficient to induce mid-DA neurons along the anteroposterior axis and confirms the observations from the En1+/Otx2 mutants that the size ratio between the mid-DA and the rost-5-HT neurons is determined by the position of the MHO. WT, Wild type.

Similar articles

Cited by

References

    1. Acampora D, Avantaggiato V, Tuorto F, Simeone A ( 1997) Genetic control of brain morphogenesis through Otx gene dosage requirement. Development 124: 3639–3650. - PubMed
    1. Barr CL, Xu C, Kroft J, Feng Y, Wigg K, Zai G, Tannock R, Schachar R, Malone M, Roberts W, Nothen MM, Grunhage F, Vandenbergh DJ, Uhl G, Sunohara G, King N, Kennedy JL ( 2001) Haplotype study of three polymorphisms at the dopamine transporter locus confirm linkage to attention-deficit/hyperactivity disorder. Biol Psychiatry 49: 333–339. - PubMed
    1. Björklund A, Lindvall O ( 1984) Dopamine containing systems in the CNS. In: Handbook of chemical neuroanatomy, Vol II, Classical transmitter in the CNS, Pt I (Björklund A, Hökfeld, T, eds), pp 55–122. Amsterdam: Elsevier.
    1. Broccoli V, Boncinelli E, Wurst W ( 1999) The caudal limit of Otx2 expression positions the isthmic organizer. Nature 401: 164–168. - PubMed
    1. Castellanos FX, Tannock R ( 2002) Neuroscience of attention-deficit/hyperactivity disorder: the search for endophenotypes. Nat Rev Neurosci 3: 617–628. - PubMed

Publication types

MeSH terms

LinkOut - more resources