. 2003 May 15;23(10):4228-39.
doi: 10.1523/JNEUROSCI.23-10-04228.2003.

Vasopressin-induced cytoplasmic and nuclear calcium signaling in embryonic cortical astrocytes: dynamics of calcium and calcium-dependent kinase translocation

Affiliations

Vasopressin-induced cytoplasmic and nuclear calcium signaling in embryonic cortical astrocytes: dynamics of calcium and calcium-dependent kinase translocation

Lixia Zhao et al. J Neurosci. .

Abstract

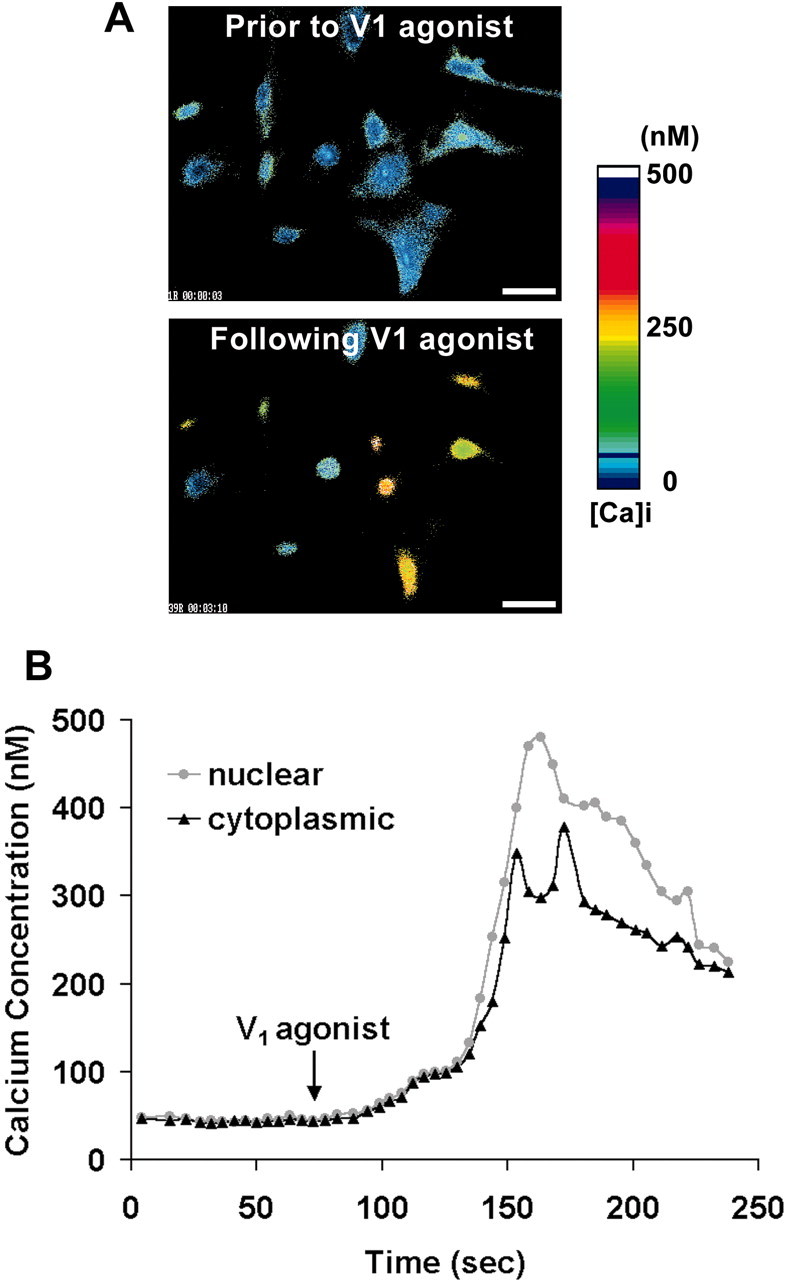
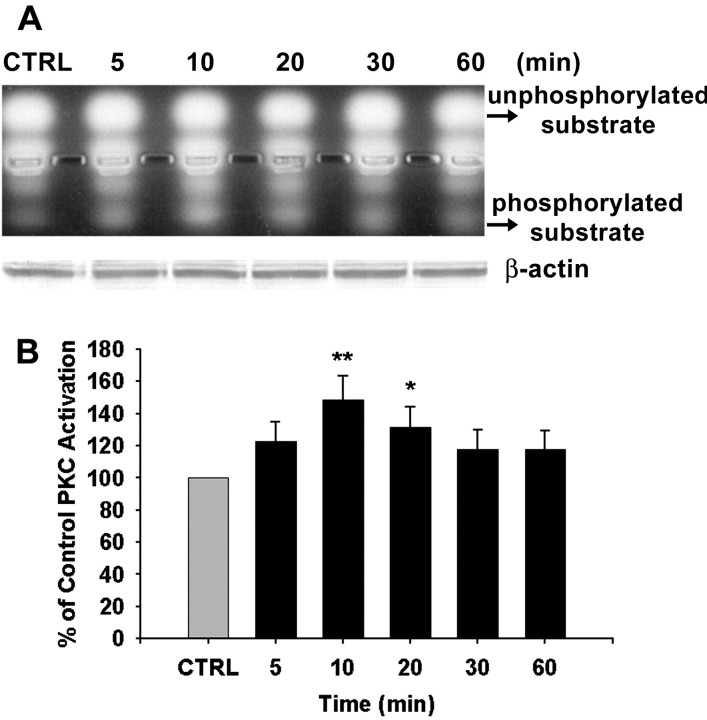
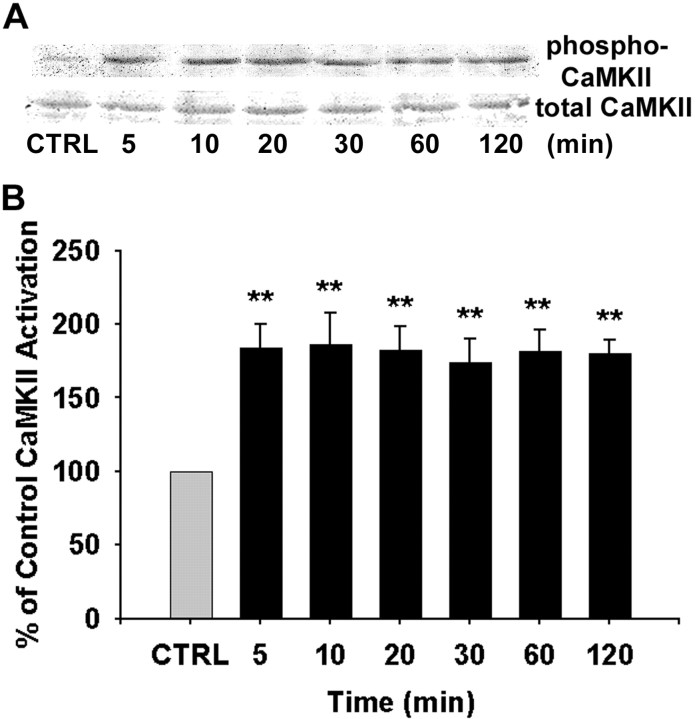
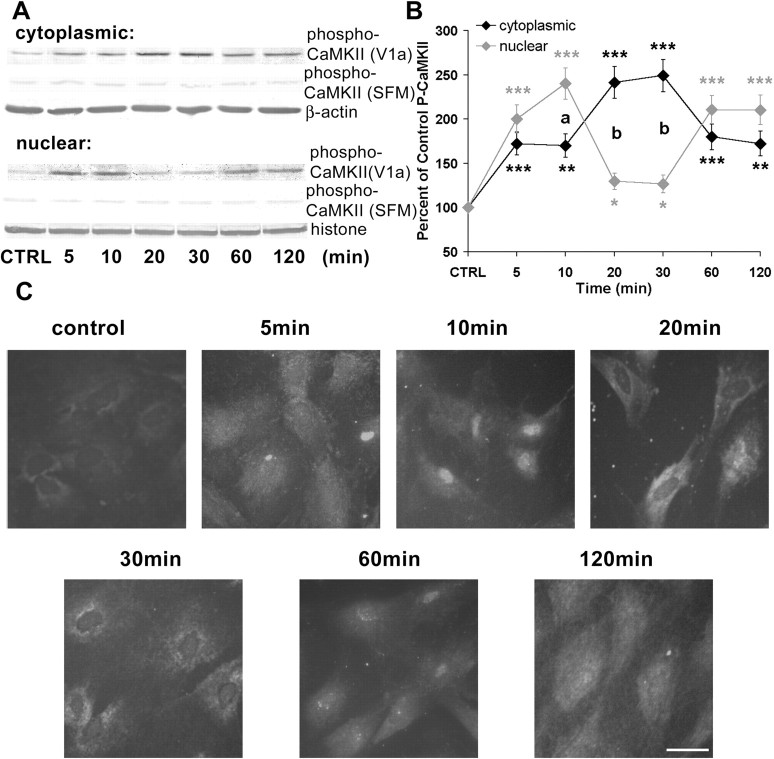
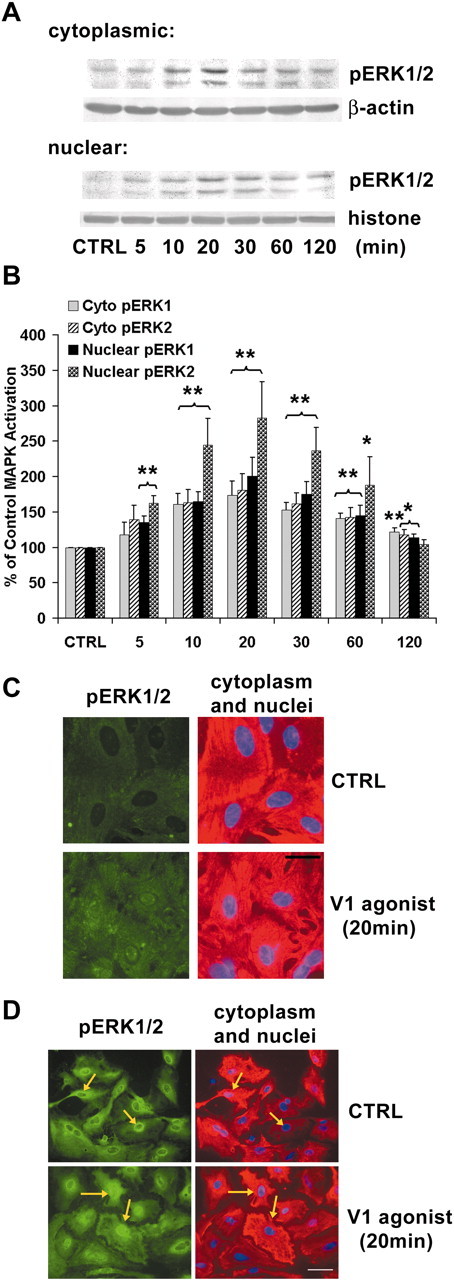
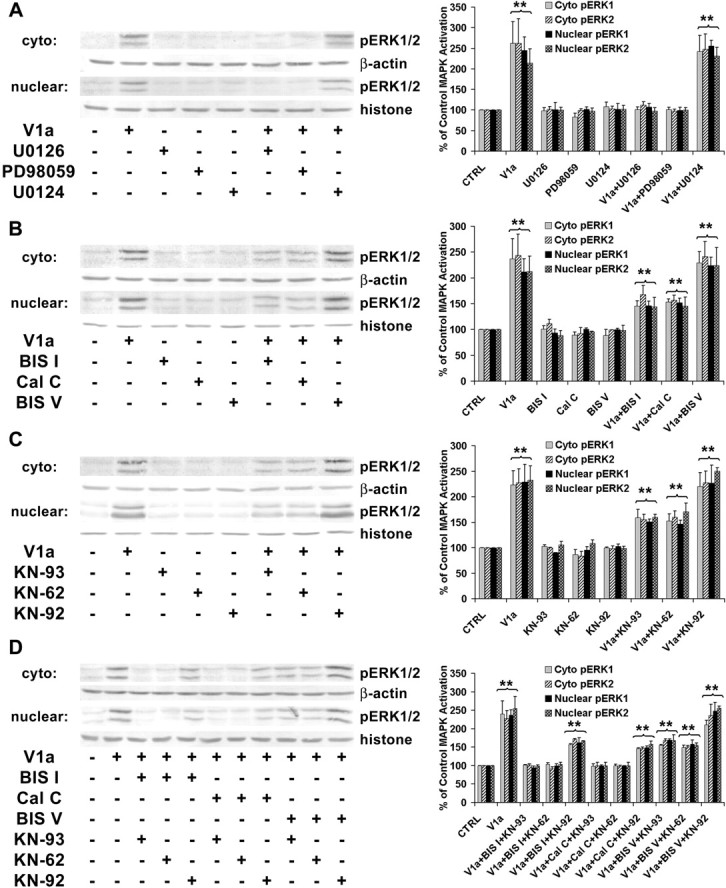
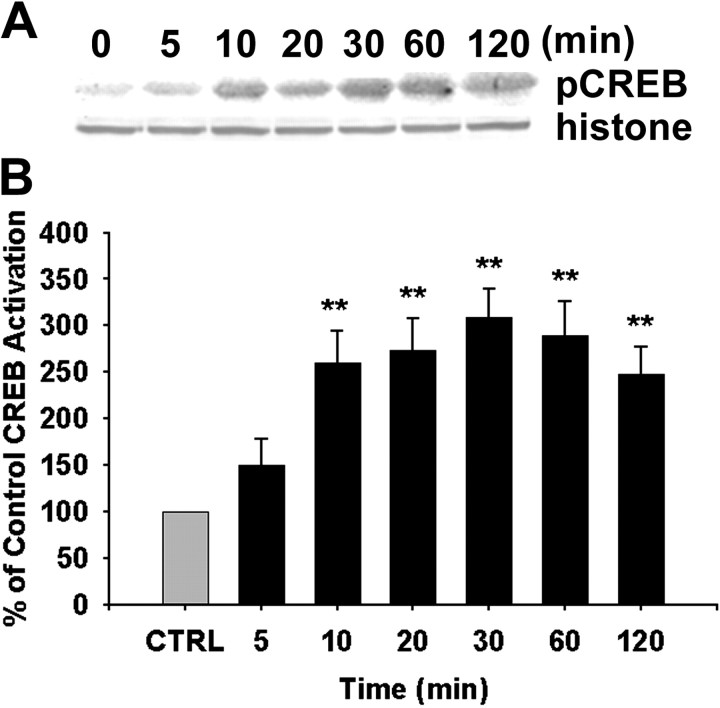
The present study sought to determine the downstream consequences of V1a vasopressin receptor (V1aR) activation of Ca2+ signaling in cortical astrocytes. Results of these analyses demonstrated that V1aR activation led to a marked increase in both cytoplasmic and nuclear Ca2+. We also investigated V1aR activation of Ca2+-activated signaling kinases, protein kinase C (PKC), Ca2+/calmodulin-dependent protein kinase II (CaMKII), and the mitogen-activated protein (MAP) kinases [MAPK and extracellular signal-regulated kinases 1 and 2 (ERK1/2)], their localization within cytoplasmic and nuclear compartments, and activation of their downstream nuclear target, the transcription factor cAMP response element-binding protein (CREB). Results of these analyses demonstrated that V1aR activation led to a significant rise in PKC, CaMKII, and ERK1/2 activation, with CaMKII and ERK1/2 demonstrating dynamic transport between cytoplasmic and nuclear compartments. Although no evidence of PKC translocation was apparent, PKC and CaMKs were required for activation and nuclear translocation of ERK1/2. Subsequent to CaMKII and ERK1/2 translocation to the nucleus, CREB activation occurred and was found to be dependent on upstream activation of ERK1/2 and CaMKs. These data provide the first systematic analysis of the V1aR-induced Ca2+ signaling cascade in cortical astrocytes. In addition, results of this study introduce a heretofore unknown effect of vasopressin, dynamic Ca2+ signaling between the cytoplasm and nucleus that leads to comparable dynamics of kinase activation and shuttling between cytoplasmic and nuclear compartments. Implications for development and regeneration induced by V1aR activation of CREB-regulated gene expression in cortical astrocytes are discussed.


Figures

Figure 1.
Figure 1.
Laser scanning confocal fluo-3 Ca2+ images of V1 agonist-induced [Ca2+]c and [Ca2+]n rise in cortical astrocytes. A, Cortical astrocytes were loaded with fluo-3, and confocal images were captured at 0, 50, 100, and 200 sec after V1 agonist was added to the cells. After addition of V1 agonist for 50 sec, the fluorescence intensity was increased in both cytoplasmic and nuclear compartments, with a much higher Ca2+ signal in the nucleus. The fluorescence intensity decreased slightly in the cytoplasm but became more concentrated in the nucleus at 100 sec. At 200 sec, both cytoplasmic and nuclear fluorescence intensity were decreased. B, Confocal images were processed with the InCyt2 fluorescence imaging system to transform gray-scale images into color for better visualization of [Ca2+]c and [Ca2+]n rise, especially nuclear Ca2+ localization. Scale bar, 20 μm.
Figure 2.
Figure 2.
Cytoplasmic [Ca2+]c and nuclear [Ca2+]n rise in response to V1 agonist in cortical astrocytes. Cortical astrocytes were loaded with fura-2, and Ca2+ images were recorded with the InCyt2 fluorescence imaging system. A, Fura-2-generated Ca2+ images under basal conditions and after addition of V1 agonist for 100 sec. V1 agonist induced a marked nuclear Ca2+ compartmentalization. Scale bar, 30 μm. B, Window apertures were used to locate the cytoplasm and nucleus of one representative astrocyte, and [Ca2+]c and [Ca2+]n were plotted against time. V1 agonist was added where indicated and was present throughout the entire observation period. Note that Ca2+ was increased initially in both the cytoplasm and nucleus, followed by a rapid and transient Ca2+ localization into the nucleus. After the rise in [Ca2+]n, translocation of nuclear Ca2+ back to the cytoplasm occur red before there turn to baseline total [Ca2+]i.
Figure 3.
Figure 3.
PKC activation in cortical astrocytes in response to V1 agonist. A, Primary cortical astrocytes were treated with V1 agonist (100 nmol) for 5, 10, 20, 30, and 60 min, and protein samples were collected in the PKC extraction buffer, which ensured integrity of PKC structure and activity. PKC activity was assayed with fluorescent PKC peptide substrate. Samples were then loaded onto 0.8% agarose gel to separate phosphorylated and unphosphorylated substrate peptides. PKC activity peaked at 10 min after exposure, whereas levels ofβ-actin protein were unchanged. B, The percentage increase in PKC activity is presented in the bar graph, in which each bar represents the mean ± SEM (n = 4 for each exposure period). *p < 0.05; **p < 0.01 versus control (CTRL).
Figure 4.
Figure 4.
CaMKII activation in response to V1 agonist in whole-cell extracts of cortical astrocytes. A, Western immunoblots showing activation of CaMKII. Primary cortical astrocytes were treated with V1 agonist for indicated periods. Whole-cell lysates were subjected to SDS-PAGE and probed with anti-phospho-CaMKII and anti-total CaMKII. Although levels of total CaMKII protein were unchanged, the level of phospho-CaMKII increased dramatically after 5 min of exposure, and the activation persisted throughout the experiment. B, The percentage increase in CaMKII activation is presented in the bar graph, in which each bar represents the mean ± SEM (n = 6 for each exposure period). **p < 0.01 versus control (CTRL).
Figure 5.
Figure 5.
CaMKII activation and dynamic translocation in cytoplasmic and nuclear compartments of cortical astrocytes. A, Western immunoblots showing activation of CaMKII and translocation of activated CaMKII between cytoplasmic and nuclear compartments of cortical astrocytes. Primary cortical astrocytes were treated with V1 agonist (V1a) for indicated periods. Cytoplasmic and nuclear lysates were subjected to SDS-PAGE and probed with anti-phospho-CaMKII. The cytoplasmic protein levels were normalized against β-actin levels and nuclear protein levels against histone H1 protein levels. B, The percentage increase in CaMKII activation in cytoplasmic and nuclear lysates is presented in the linegraph, in which each point represents the mean±SEM (n = 4 for each exposure period). *p < 0.05, **p < 0.01, ***p < 0.001 versus control; ap < 0.05, bp < 0.01 for comparison between cytoplasmic and nuclear percentage increases. C, Immunofluorescence of active CaMKII in cortical astrocytes after exposure to V1 agonist for indicated periods. The immunocytochemical data are consistent with the Western immunoblot data shown in Figures 4 and 5, A and B. Scale bar, 25 μm. CTRL, Control; SFM, Serum-free medium.
Figure 6.
Figure 6.
Activation and translocation of ERK1 and ERK2 in response to V1 agonist in cytoplasmic and nuclear compartments of cortical astrocytes.A, Western immunoblots showing activation of ERK1/2 in cytoplasmic and nuclear extracts of cortical astrocytes. Primary cortical astrocytes were treated with V1 agonist for indicated periods. Cytoplasmic and nuclear lysates were subjected to SDS-PAGE and probed with anti-pERK1/2. Both ERK1 and ERK2 were activated in a time-dependent manner in both cytoplasmic and nuclear compartments.B, The percentage increase in ERK1 and ERK2 activation is presented in the bar graphs. Each bar represents the mean±SEM (n = 6 for each exposure period). *p < 0.05; **p < 0.01 versus control. C, Immunofluorescence of active ERK1/2 (green) in cortical astrocytes before and after exposure to V1 agonist for 20 min. The corresponding cytoplasmic GFAP (red) and nuclear DAPI (blue) are shown on the right. Scale bar, 20 μm. D, Immunofluorescence of total ERK1/2 (green) in cortical astrocytes before and after exposure to V1 agonist for 20 min. Corresponding cytoplasmic GFAP (red) and nuclear DAPI (blue) are shown on the right. Arrows point to the astrocytes that exhibited cytoplasm-to-nucleus ERK translocation. Scale bar, 30 μm. CTRL, Control.
Figure 7.
Figure 7.
Activation of ERK1/2 required upstream MEK, PKC, and CaMKs. A, Western immunoblotting data showing abolishment of ERK1/2 activation in cytoplasmic and nuclear extracts of cortical astrocytes by MEK inhibitors U0126 and PD98059. ERK1/2 activation was not affected by U0124, a compound structurally similar to U0126 but inactive as a MEK inhibitor. Primary cortical astrocytes were treated with or without V1 agonist (V1a) in the presence or absence of U0126 (10 μm), PD98059 (25 μm), or U0124 (20 μm) for 20 min. Cytoplasmic and nuclear lysates were subjected to SDS-PAGE and probed with anti-pERK1/2. The cytoplasmic protein levels were normalized against β-actin levels and nuclear protein levels against histone H1 protein levels. The percentage increase in ERK1 and ERK2 activation relative to control is presented in the bar graphs. Each bar represents the mean±SEM(n = 3 for each condition). **p < 0.01 versus control. B, Partial inhibition of ERK1/2 activation in astrocytes by PKC inhibitors BISI and CalC. ERK1/2 activation was not affected by BISV, a compound structurally similar to BISI but inactive as a PKC inhibitor. Astrocytes were treated with or without V1 agonist in the presence or absence of BISI (5 μm), CalC(500 nm), or BISV (5 μm) for 20 min. Each bar in the graph represents the mean±SEM (n = 4 for each condition). **p < 0.01 versus control. C, Partial inhibition of ERK1/2 activation by CaMK inhibitors KN-93 and KN-62. ERK1/2 activation was not affected by KN-92, a compound structurally similar to KN-93 but inactive as a CaMK inhibitor. Astrocytes were treated with or without V1 agonist in the presence or absence of KN-93 (10 μm), KN-62 (10 μm), or KN-92 (10 μm) for 20 min. Each bar in the graph represents the mean±SEM (n = 5 for each condition). **p < 0.01 versus control. D, Complete abolishment of ERK1/2 activation by a combination of PKC inhibitors and CaMK inhibitors in cytoplasmic and nuclear extracts of cortical astrocytes. Astrocytes were treated with or without V1 agonist in the presence or absence of various combinations of inhibitors for 20 min. Each bar in the graph represents the mean±SEM (n = 4 for each condition). **p < 0.01 versus control. CTRL, Control; cyto, cytoplasmic.
Figure 8.
Figure 8.
Activation of CREB in nuclei of cortical astrocytes in response to V1 agonist. A, Western immunoblots showing activation of CREB in nuclear extracts of cortical astrocytes. Primary cortical astrocytes were treated with V1 agonist for indicated periods. Nuclear lysates were subjected to SDS-PAGE and probed with anti-pCREB. Levels of pCREB increased at 10 min and persisted until 120 min. Nuclear protein levels were normalized against histone H1 protein levels. B, The percentage increase in CREB activation relative to control is presented in a bar graph. Each bar represents the mean ± SEM (n = 8 for each exposure period). **p < 0.01 versus control (CTRL).
Figure 9.
Figure 9.
Activation of CREB is dependent on both MAPK and CaMK activation. A, Western immunoblotting data showing partial inhibition of CREB activation by the MEK inhibitors U0126 and PD98059. CREB activation was not affected by U0124, a compound structurally similar to U0126 but inactive as a MEK inhibitor. Primary cortical astrocytes were treated with or without V1 agonist (V1a) in the presence or absence of U0126 (10μm), PD98059 (25μm), or U0124 (20μm) for 30 min. Each bar in the graph represents the mean ± SEM (n = 4 for each condition). **p < 0.01 versus control. B, Partial inhibition of CREB activation by the CaMK inhibitors KN-93 and KN-62. CREB activation was not affected by KN-92, a compound structurally similar to KN-93 but inactive as a CaMK inhibitor. Astrocytes were treated with or without V1 agonist in the presence or absence of KN-93 (10 μm), KN-62 (10μm), or KN-92 (10μm) for 30 min. n = 4 for each condition. **p < 0.01 versus control. C, Complete inhibition of CREB activation by a combination of MEK inhibitors and CaMK inhibitors. Each bar in the graph represents the mean ± SEM (n = 4 for each condition). **p < 0.01 versus control (CTRL).

Similar articles

Cited by

References

    1. Abe K, Saito H ( 2000) The p44/42 mitogen-activated protein kinase cascade is involved in the induction and maintenance of astrocyte stellation mediated by protein kinase C. Neurosci Res 36: 251–257. - PubMed
    1. Bachs O, Agell N, Carafoli E ( 1994) Calmodulin and calmodulin-binding proteins in the nucleus. Cell Calcium 16: 289–296. - PubMed
    1. Berridge MJ ( 1993) Inositol trisphosphate and calcium signalling. Nature 361: 315–325. - PubMed
    1. Bezzi P, Domercq M, Vesce S, Volterra A ( 2001) Neuron-astrocyte cross-talk during synaptic transmission: physiological and neuropathological implications. Prog Brain Res 132: 255–265. - PubMed
    1. Boer GJ ( 1985) Vasopressin and brain development: studies using the Brattleboro rat. Peptides 6: 49–62. - PubMed

Publication types

MeSH terms

Substances

LinkOut - more resources