. 2003 Jun 24;100(13):7865-70.
doi: 10.1073/pnas.1232225100. Epub 2003 May 23.

Division site selection in Escherichia coli involves dynamic redistribution of Min proteins within coiled structures that extend between the two cell poles

Affiliations

Division site selection in Escherichia coli involves dynamic redistribution of Min proteins within coiled structures that extend between the two cell poles

Yu-Ling Shih et al. Proc Natl Acad Sci U S A. .

Abstract

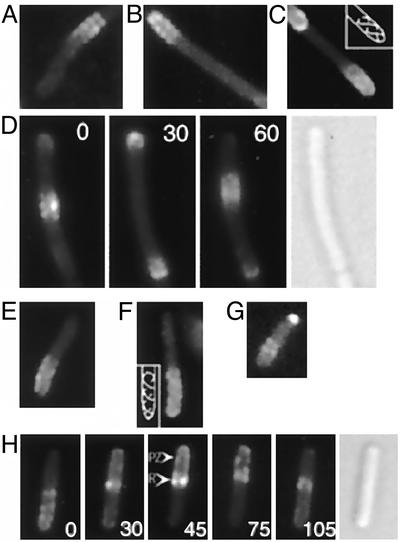
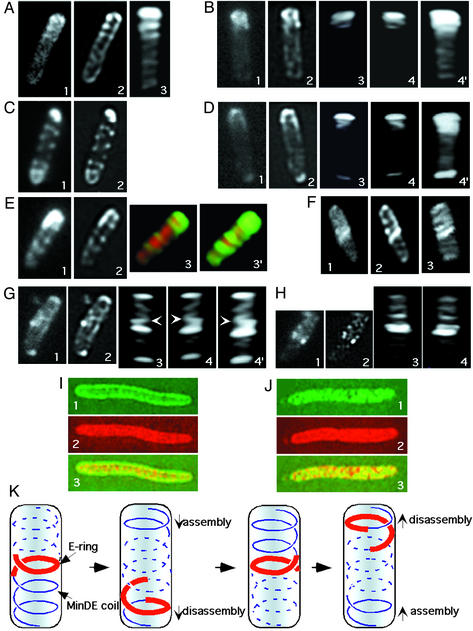
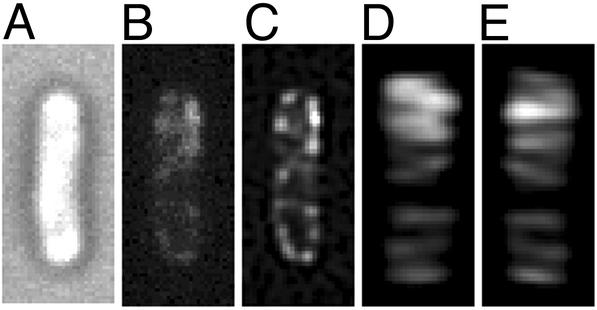
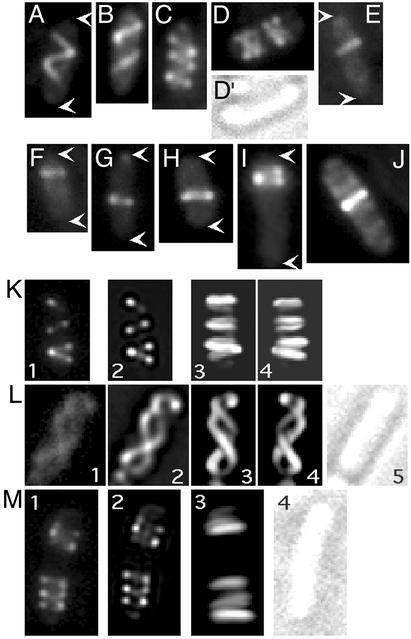
The MinCDE proteins of Escherichia coli are required for proper placement of the division septum at midcell. The site selection process requires the rapid oscillatory redistribution of the proteins from pole to pole. We report that the three Min proteins are organized into extended membrane-associated coiled structures that wind around the cell between the two poles. The pole-to-pole oscillation of the proteins reflects oscillatory changes in their distribution within the coiled structure. We also report that the E. coli MreB protein, which is required for maintaining the rod shape of the cell, also forms extended coiled structures, which are similar to the MreB structures that have previously been reported in Bacillus subtilis. The MreB and MinCDE coiled arrays do not appear identical. The results suggest that at least two functionally distinct cytoskeletal-like elements are present in E. coli and that structures of this type can undergo dynamic changes that play important roles in division site placement and possibly other aspects of the life of the cell.


Figures

Fig. 1.
Fig. 1.
MinD and MinE structures in living cells. (A–D) Fluorescence images of YFP-MinD in unfixed cells of strain HL1/pFX40 [ΔminDE/Plac-yfp::minD minE]. (A–C) Random single images. (D) Time-lapse micrographs taken at 30-sec intervals, showing oscillation of a MinD zone between midcell and the cell poles. (E–H) Fluorescence images of MinE-YFP in unfixed cells of strain RC1/pFX55 [Δmin/Plac-minC minD minE::yfp]. (E–G) Random single images. (H) Time-lapse micrographs showing pole-to-pole oscillation of an E-ring and MinE polar zone. Time intervals, in sec, are indicated by numbers within the panels. In C and F, the images suggest the presence of two helical structures within the polar zone, as indicated in the Insets. Nomarski images are shown in D and H. PZ, polar zone; R, MinE ring.
Fig. 2.
Fig. 2.
MinD and MinE structures in optically sectioned cells. Cells were fixed and subjected to optical sectioning and processing as described in Materials and Methods. The first image in each series is the initial raw image of one section without deconvolution; image 2 is the same section after deconvolution; and images 3, 4, and 4′ are three-dimensional reconstructions from the series of deconvolved images. (A and C) YFP-MinD fluorescence, strain RC1/pFX40 [Δmin/Plac-yfp::minD minE]. (B and D) GFP-MinD fluorescence, strain RC1/pFX9 [Δmin/Plac-gfp::minD minE]. In image 4, the three-dimensional image shown in image 3 was rotated ≈180° around the long axis of the cell. Image 4′ is identical to image 4 except that contrast has been increased to permit visualization of the less bright structures in the lower part of the cell. (E) YFP-MinD and CFP fluorescence, strain RC1/pFX40/pLE18 [Δmin/Plac-yfp::minD minE/Para-cfp]. Images 1 and 2 show YFP-MinD. Images 3 and 3′ show overlays of YFP-MinD (green) and CFP (red) fluorescence. CFP acts as a cytoplasmic marker. Image 3′ is identical to image 3, except that contrast has been increased to permit better visualization of the coils in the lower portion of the cell. (F–H) MinE-GFP fluorescence, RC1/pSY1083G [Δmin/Plac-minC minD minE::gfp]. In image 4, the three-dimensional representation shown in image 3 was rotated 180° around the long axis of the cell. Image 4′ is identical to image 4 except that contrast has been increased to permit visualization of the less bright structures in the lower part of the cell. The arrows in G3, G4, and G4′ indicate the junction between the coiled E-ring and the coiled array in the polar zone. (I) YFP-MinD (green, images 1 and 3) and CFP (red, images 2 and 3) in strain RC1/pYLS97/pLE18 [Δmin/Plac-yfp::minD/Para-cfp]. CFP is used as a cytoplasmic marker. In image 3, the representations in images 1 and 2 are overlaid. (J) MinE-YFP (green, images 1 and 3) and CFP (red, images 2 and 3) in strain RC1/pLE11/pLE18 [Δmin/Plac-minE::yfp/Para-cfp]. In image 3, the representations in images 1 and 2 are overlaid. (K) Graphic model illustrating coiled arrays at different stages of the oscillation cycle. Red lines represent the MinE ring. Blue lines represent MinDE coiled structures within the polar zones (solid lines) and in the opposite end of the cell (interrupted lines). For simplicity, a single coiled array is shown in each end of the cell, although the results suggest that some cells may contain more than one coiled array, and the helical structure may, in some cases, extend over the entire length of the cell.
Fig. 3.
Fig. 3.
GFP-MinC in the presence of MinD and MinE. A cell of strain RC1/pYLS49–2 [Δmin/Plac-gfp::minC minD minE] is shown. (A) Nomarski image. (B) Raw image without deconvolution. (C) Deconvolved image of the same optical section shown in B.(D and E). Three-dimensional reconstruction from the set of optically sectioned images, viewed at 0° (D) and 180° (E) rotation around the long axis of the cell.
Fig. 4.
Fig. 4.
YFP-MreB structures. Fluorescence images of selected cells of strain MC1000/pLE7 [wt/Plac-yfp::mreB] after growth at 30° for 3–4 h in the presence of 10 μM IPTG, containing extended helical arrays (A, B, K, and L), compressed helical arrays (C, D, and M), and single coils or loops (E–J). White arrows indicate the ends of cells. (A–J) Raw images. In K–M, cells were subjected to optical sectioning. Image 1 is a raw image of a single section before deconvolution and image 2 is the same section after deconvolution. In K, L, and M, images 3 and 4 are three-dimensional reconstructions of the stacks of deconvolved images, and in K and L, image 4, the three-dimensional representation in image 3 was rotated ≈180° around the long axis of the cell.

Comment in

  • Bacterial cell division spirals into control.
    Gitai Z, Shapiro L. Gitai Z, et al. Proc Natl Acad Sci U S A. 2003 Jun 24;100(13):7423-4. doi: 10.1073/pnas.1332806100. Epub 2003 Jun 16. Proc Natl Acad Sci U S A. 2003. PMID: 12810947 Free PMC article. No abstract available.

References

    1. Jones, L., Carballido-Lopez, R. & Errington, J. (2001) Cell 104, 913-922. - PubMed
    1. Rothfield, L. I., Shih, Y.-L. & King, G. F. (2001) Cell 106, 13-16. - PubMed
    1. Raskin, D. & de Boer, P. (1999) Proc. Natl. Acad. Sci. USA 96, 4971-4976. - PMC - PubMed
    1. Rowland, S. L., Fu, X., Sayed, M. A., Zhang, Y., Cook, W. R. & Rothfield, L. I. (2000) J. Bacteriol. 182, 613-619. - PMC - PubMed
    1. Szeto, T., Rowland, S., Rothfield, L. & King, G. F. (2002) Proc. Natl. Acad. Sci. USA 99, 15693-15698. - PMC - PubMed

Publication types

MeSH terms