

doi: 10.1128/jvi.77.12.6979-6987.2003.
Varicella-zoster virus DNA in cells isolated from human trigeminal ganglia
Affiliations
- PMID: 12768016
- PMCID: PMC156183
- DOI: 10.1128/jvi.77.12.6979-6987.2003
Item in Clipboard
Varicella-zoster virus DNA in cells isolated from human trigeminal ganglia
J Virol.
2003 Jun.
Abstract
To determine the type of cell(s) that contain latent varicella-zoster virus (VZV) DNA, we prepared pure populations of neurons and satellite cells from trigeminal ganglia of 18 humans who had previously had a VZV infection. VZV DNA was present in 34 of 2,226 neurons (1.5%) and in none of 20,700 satellite cells. There was an average of 4.7 (range of 2 to 9) copies of VZV DNA per latently infected neuron. Latent VZV DNA was primarily present in large neurons, whereas the size distribution of herpes simplex virus DNA was markedly different.
Figures
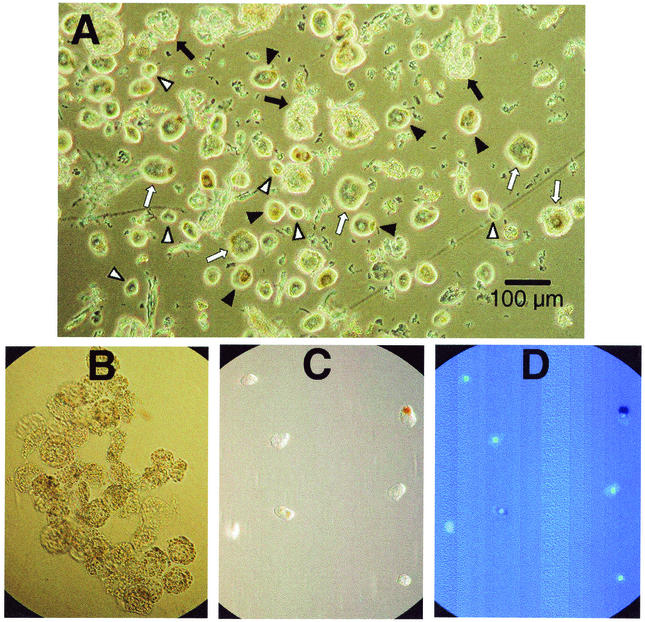
Photomicrographs of neurons and satellite cells. (A) Minced ganglia after filtration and sedimentation, showing small (▿), medium (▾), and large (⇒) neurons as well as clumps of satellite cells (➞). Magnification, ×20 (Hoffman optics). (B) Clumps of isolated satellite cells. Magnification, ×20 (Hoffman optics). (C) Single neurons viewed with phase contrast. Magnification, ×20. (D) Same field as panel C stained with DAPI, demonstrating that neurons are free of attached satellite cells. Magnification, ×20 (fluorescence).
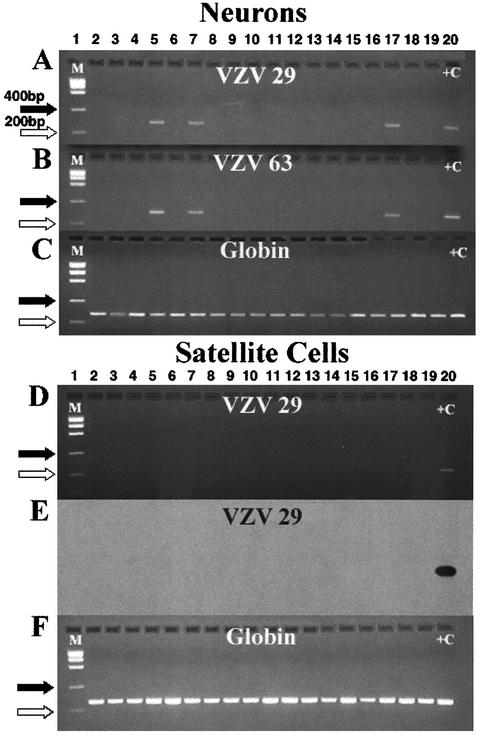
PCR analysis of isolated neurons and satellite cells from ganglion HG-72. Panels A, B, and C show agarose gels of direct PCR products of DNA from isolated neurons. Panels D and F show gels of direct PCR products from DNA from satellite cells. Panels A and B show that the same three samples (lanes 5, 7, and 17) are positive for VZV genes 29 and 63. Panel C shows the detection of the globin gene in all samples. The direct PCR analysis for VZV gene 29 in satellite cells is shown in gel D, and the corresponding Southern blot is shown in gel E. Gel F shows that all satellite cell samples contain the globin gene. The primers used for VZV gene 29 were VZV 29J and VZV 29K. The primers used for VZV gene 63 are described in Materials and Methods. +C indicates the appropriate positive control for each panel. M indicates the molecular size markers. The sizes for marker bands of 200 (⇒) and 400 (➞) nucleotides are indicated.
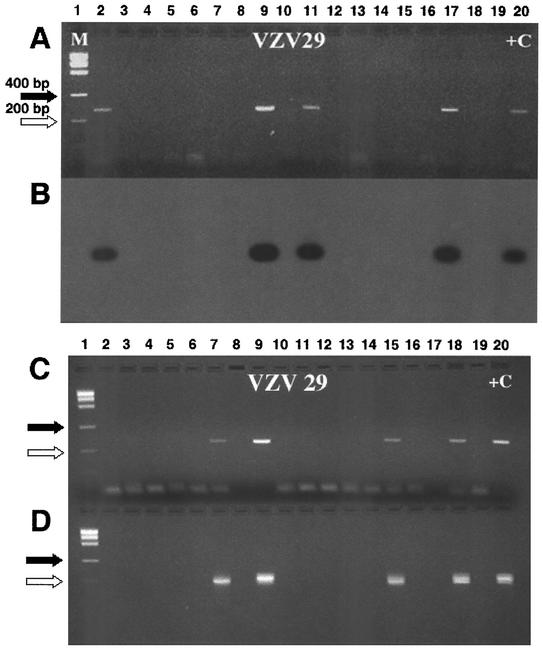
Southern analyses and nested PCR of VZV gene 29. (A) Direct PCR of 18 samples containing 10 neurons prepared from ganglion HG-93. (B) A Southern blot of four PCR-positive samples (lanes 2, 9, 11, and 17) shown in panel A demonstrated corresponding positive bands. (C) Direct PCR of 10 neuron samples from ganglia HG-86 (lanes 2 to 11) and HG-95 (lanes 12 to 19). (D) A nested PCR from the direct PCR shown in panel C with primers n-VZV29j (5′-ACTCACTACCAGTCATTTCTATC-3′) and n-VZV29k (5′-GTATTTTCTGGCTCTAATCCAAG-3′) amplified DNA fragments of 213 nucleotides. +C indicates the appropriate positive control for each panel. M indicates the molecular size markers. The sizes for marker bands of 200 (⇒) and 400 (➞) nucleotides are indicated.
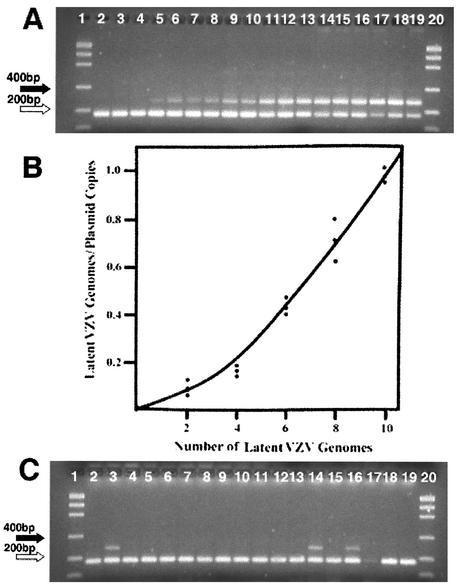
Quantitative competitive PCR. A preliminary quantitative competitive PCR experiment was carried out to establish the amount of VZV gene 29 DNA in a pooled sample of VZV-positive neurons. This pooled sample was used as the latent VZV standard, and aliquots corresponding to 2, 4, 6, 8, and 10 copies of the latent VZV gene 29 were added to samples containing 10 copies of the internal VZV plasmid standard. The resulting competitive PCR is shown in panel A. The results from the quantitative scan of panel A were used to generate the curve shown in panel B. This curve was used to determine the content of latent VZV gene 29 in multiple samples of 10 neurons. A representative quantitative competitive PCR for 18 tubes containing 10 neuron samples is shown in panel C. Three tubes contained VZV DNA, and the ratio of the band intensities was utilized to determine the copy number. These data are included in Table 4 (as HG-100). The sizes for marker bands of 200 (⇒) and 400 (➞) nucleotides are indicated.
References
-
- Cai, G. Y., L. I. Pizer, and M. J. Levin. 2002. Fractionation of neurons and satellite cells from human sensory ganglia in order to study herpesvirus latency. J. Virol. Methods 104:21-32. - PubMed
Publication types
MeSH terms
Substances
LinkOut - more resources
Full Text Sources
