Comparative Study
. 2003 Jun;77(12):7131-8.
doi: 10.1128/jvi.77.12.7131-7138.2003.

Mutagenesis versus inhibition in the efficiency of extinction of foot-and-mouth disease virus

Affiliations
Comparative Study

Mutagenesis versus inhibition in the efficiency of extinction of foot-and-mouth disease virus

Nonia Pariente et al. J Virol. 2003 Jun.

Abstract

RNA viruses replicate near the error threshold for maintenance of genetic information, and an increase in mutation frequency during replication may drive RNA viruses to extinction in a process termed lethal mutagenesis. This report addresses the efficiency of extinction (versus escape from extinction) of foot-and-mouth disease virus (FMDV) by combinations of the mutagenic base analog 5-fluorouracil (FU) and the antiviral inhibitors guanidine hydrochloride (G) and heparin (H). Selection of G- or H-resistant, extinction-escape mutants occurred with low-fitness virus only in the absence of FU and with high-fitness virus with some mutagen-inhibitor combinations tested. The combination of FU, G, and H prevented selection of extinction-escape mutants in all cases examined, and extinction of high-fitness FMDV could not be achieved by equivalent inhibitory activity exerted by the nonmutagenic agents. The G-resistant phenotype was mapped in nonstructural protein 2C by introducing the relevant mutations in infectious cDNA clones. Decreases in FMDV infectivity were accompanied by modest decreases in the intracellular and extracellular levels of FMDV RNA, maximal intracellular concentrations of FU triphosphate, and a decrease in the intracellular concentrations of UTP. In addition to indicating a key participation of mutagenesis in virus extinction, the results suggest that picornaviruses provide versatile experimental systems to approach the problem of extinction failure associated with inhibitor-escape mutants during treatments based on enhanced mutagenesis.


Figures

FIG. 1.
FIG. 1.
FUTP accumulation and changes in intracellular ribonucleotide concentrations in FU-treated BHK-21 cells. (A) Intracellular FUTP concentrations were determined from BHK-21 cell cultures treated with FU (50 μg/ml) (dashed black lines with black circles), FU (100 μg/ml) (dashed black lines with black diamonds) and FU (200 μg/ml) (black lines with white squares). Assuming a cell volume of 3.6 ml/109 cells (55), the maximal intracellular FUTP concentration was approximately 7.5 mM. (B) Intracellular NTP concentrations were determined from BHK-21 cell cultures treated with Dulbecco's modified Eagle medium (DMEM) (solid lines with black squares), FU (50 μg/ml) (dashed gray lines with white circles), FU (100 μg/ml) (dashed gray lines with gray diamonds), and FU (200 μg/ml) (black lines with white squares). Note that the scale shown in ordinate is different in each graph. In all cases, samples were prepared for HPLC analysis at 4, 7, 10, and 13 h of exposure. After 13 h, the plates were mock infected (medium was removed and 200 μl of DMEM was added to mimic a real infection), and after 1 h, fresh medium with FU was added. NTPs were again extracted at 18, 21, 24, and 38 h (4, 7, 10, and 24 h after fresh medium was added).
FIG. 2.
FIG. 2.
Production of infectious virus upon passage of FMDVs Hformula image(A and B), REDpt60 (C and D), and MARLS (E and F) in the presence of different drug combinations in BHK-21 cells. Conditions for mutagenic and antiviral treatments have been previously described (35). In all cases, virus was tested by infecting 9 × 10⁵ BHK-21 cells with 5 ×10⁴ PFU of virus, and the next passages were carried out by infecting cells with 0.1 ml of supernatant from the previous passage. The multiplicity of infection can be calculated from the titers shown in ordinate. The legend panels identify drug treatments of the assays shown on their left. DMEM indicates culture medium in the absence of mutagen and inhibitor. Passages one to four depicted in panel E were published previously (35), and are included here for completeness. Preextinction populations are indicated by arrows. Viral extinction was ascertained by three additional blind passages in the absence of mutagen and inhibitors, with no evidence of infectivity or RT-PCR-amplifiable material in the supernatant of the third passage (35, 52). All titrations were done in triplicate. Standard deviations (not included in the plots) never exceeded 20%.
FIG. 3.
FIG. 3.
FMDV chimeric plasmids. The scheme on the top of the figure represents FMDV C-S8c1 genomic regions encoding proteins VP4 to 3D. Numbering of FMDV genomic nucleotides is according to Toja et al. (54). Relevant restriction sites used for construction of chimeric cDNAs are indicated at the top, with the 5′ position of the restriction site given in parentheses. Below the FMDV C-S8c1 genome scheme are the different chimeric plasmids used in this study. In plasmid pC (34), the C-S8c1 FMDV region spans residues 1739 to 7427, which correspond to protein residues S33 of VP4 to W283 of 3D. The rest of the FMDV genome is that of FMDV O1K (serotype O) (shaded boxes) (60). Bold residues in the 2C box are those introduced to study their implication in resistance to G. The position numbers of amino acids in 2C that differ between C-S8c1 and MARLS and the positions on the 2C protein altered by site-directed mutagenesis are indicated at the bottom.
FIG. 4.
FIG. 4.
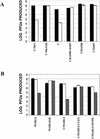
Viral production in the presence or absence of G. Black columns represent viral production in the absence of G, empty columns indicate viral production in the presence of 4 mM G, and gray columns indicate viral production in the presence of 8 mM G. BHK-21 cells (2 × 10⁶ to 4 × 10⁶) were infected with serial dilutions of virus. After 45 min of adsorption, cells were overlaid with 0.5% agar medium with either 0, 4, or 8 mM G. After 24 h, cells were fixed with 2% formaldehyde and visualized by crystal violet staining. Viral production was estimated from the number of plaques and the viral dilution. The amino acid substitutions present in 2C of each virus tested are shown below the corresponding column. (A) Viruses derived from C-S8c1. C-S8c1GR is a G-resistant population obtained after four passages in the presence of 4 mM G. C is the virus obtained from chimera pC. (B) Viruses derived from MARLS. MARLSGR is a G-resistant population obtained after four passages in the presence of 4 mM G. Viruses were plated with 8 mM G because MARLS is partially resistant to G (there are four amino acid changes between the 2C of C-S8c1 and MARLS, and the 50% inhibitory concentration for MARLS is 2.7 times higher than that of C-S8c1) and because the difference in plaque formation was better assessed at higher concentrations of G. Sequence differences in protein 2C between the chimeras used in this experiment are depicted in Fig. 3.
FIG. 5.
FIG. 5.
Production of C-S8c1 infectious particles and RNA in one passage with different treatments. In all three panels, solid lines with circles represent infections in the presence of DMEM, dashed lines with squares denote presence of FU (200 μg/ml), and dashed lines with triangles represent treatment with FU (200 μg/ml) + G (4 mM). In all experiments, 9 × 10⁵ BHK-21 cells were infected with 5 × 10⁴ PFU of C-S8c1. (A) Viral production. Virus titers at different times after infection were determined by plaque assays on BHK-21 cell monolayers in triplicate; standard deviations (not included in the plots) never exceeded 25%. (B) Intracellular FMDV RNA level. Quantitation was done at the same time points at which virus in the media was titrated (panel A). RNA levels are the means of two independent quantitations. (C) FMDV RNA level in the culture medium. Quantitation was done at the same time points at which virus in the media was titrated (panel A). Extraction of C-S8c1 RNA has been previously described (35), and quantification was performed with the Light Cycler instrument (Roche) by using the Light Cycler RNA master SYBR Green I kit (Roche) and following the manufacturer's instructions. RNA levels are the mean of two independent quantitations. The amount of RNA at 0 h postinfection in panels B and C could not be determined because it was below the limit of reliable quantification of FMDV RNA (which is 3 × 10⁴ RNA molecules under our experimental conditions).

Similar articles

Cited by

References

    1. Airaksinen, A., N. Pariente, L. Menéndez-Arias, and E. Domingo. Curing of foot-and-mouth disease virus from persistently infected cells by ribavirin involves enhanced mutagenesis. Virology, in press. - PubMed
    1. Anderson-Sillman, K., S. Bartal, and D. R. Tershak. 1984. Guanidine-resistant poliovirus mutants produce modified 37-kilodalton proteins. J. Virol. 50:922-928. - PMC - PubMed
    1. Baltera, R. F., Jr., and D. R. Tershak. 1989. Guanidine-resistant mutants of poliovirus have distinct mutations in peptide 2C. J. Virol. 63:4441-4444. - PMC - PubMed
    1. Baranowski, E., C. M. Ruiz-Jarabo, N. Sevilla, D. Andreu, E. Beck, and E. Domingo. 2000. Cell recognition by foot-and-mouth disease virus that lacks the RGD integrin-binding motif: flexibility in aphthovirus receptor usage. J. Virol. 74:1641-1647. - PMC - PubMed
    1. Baranowski, E., N. Sevilla, N. Verdaguer, C. M. Ruiz-Jarabo, E. Beck, and E. Domingo. 1998. Multiple virulence determinants of foot-and-mouth disease virus in cell culture. J. Virol. 72:6362-6372. - PMC - PubMed

Publication types