Estimating photosynthetic radiation use efficiency using incident light and photosynthesis of individual leaves
- PMID: 12770844
- PMCID: PMC4242396
- DOI: 10.1093/aob/mcg094
Estimating photosynthetic radiation use efficiency using incident light and photosynthesis of individual leaves
Abstract
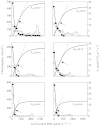
It has been theorized that photosynthetic radiation use efficiency (PhRUE) over the course of a day is constant for leaves throughout a canopy if leaf nitrogen content and photosynthetic properties are adapted to local light so that canopy photosynthesis over a day is optimized. To test this hypothesis, 'daily' photosynthesis of individual leaves of Solanum melongena plants was calculated from instantaneous rates of photosynthesis integrated over the daylight hours. Instantaneous photosynthesis was estimated from the photosynthetic responses to photosynthetically active radiation (PAR) and from the incident PAR measured on individual leaves during clear and overcast days. Plants were grown with either abundant or scarce N fertilization. Both net and gross daily photosynthesis of leaves were linearly related to daily incident PAR exposure of individual leaves, which implies constant PhRUE over a day throughout the canopy. The slope of these relationships (i.e. PhRUE) increased with N fertilization. When the relationship was calculated for hourly instead of daily periods, the regressions were curvilinear, implying that PhRUE changed with time of the day and incident radiation. Thus, linearity (i.e. constant PhRUE) was achieved only when data were integrated over the entire day. Using average PAR in place of instantaneous incident PAR increased the slope of the relationship between daily photosynthesis and incident PAR of individual leaves, and the regression became curvilinear. The slope of the relationship between daily gross photosynthesis and incident PAR of individual leaves increased for an overcast compared with a clear day, but the slope remained constant for net photosynthesis. This suggests that net PhRUE of all leaves (and thus of the whole canopy) may be constant when integrated over a day, not only when the incident PAR changes with depth in the canopy, but also when it varies on the same leaf owing to changes in daily incident PAR above the canopy. The slope of the relationship between daily net photosynthesis and incident PAR was also estimated from the photosynthetic light response curve of a leaf at the top of the canopy and from the incident PAR above the canopy, in place of that measured on individual leaves. The slope (i.e. net PhRUE) calculated in this simple way did not differ statistically from that calculated using data from individual leaves.
Figures


Similar articles
-
A simple method to estimate photosynthetic radiation use efficiency of canopies.Ann Bot. 2004 May;93(5):567-74. doi: 10.1093/aob/mch081. Epub 2004 Mar 24. Ann Bot. 2004. PMID: 15044212 Free PMC article.
-
Optimal photosynthetic use of light by tropical tree crowns achieved by adjustment of individual leaf angles and nitrogen content.Ann Bot. 2009 Mar;103(5):795-805. doi: 10.1093/aob/mcn265. Epub 2009 Jan 16. Ann Bot. 2009. PMID: 19151040 Free PMC article.
-
Effects of kaolin application on light absorption and distribution, radiation use efficiency and photosynthesis of almond and walnut canopies.Ann Bot. 2007 Feb;99(2):255-63. doi: 10.1093/aob/mcl252. Epub 2006 Nov 30. Ann Bot. 2007. PMID: 17138580 Free PMC article.
-
Elements of a dynamic systems model of canopy photosynthesis.Curr Opin Plant Biol. 2012 Jun;15(3):237-44. doi: 10.1016/j.pbi.2012.01.010. Epub 2012 Feb 9. Curr Opin Plant Biol. 2012. PMID: 22325454 Review.
-
Photosynthetic acclimation to simultaneous and interacting environmental stresses along natural light gradients: optimality and constraints.Plant Biol (Stuttg). 2004 May;6(3):254-68. doi: 10.1055/s-2004-817881. Plant Biol (Stuttg). 2004. PMID: 15143434 Review.
Cited by
-
A simple method to estimate photosynthetic radiation use efficiency of canopies.Ann Bot. 2004 May;93(5):567-74. doi: 10.1093/aob/mch081. Epub 2004 Mar 24. Ann Bot. 2004. PMID: 15044212 Free PMC article.
-
Evaluating a three dimensional model of diffuse photosynthetically active radiation in maize canopies.Int J Biometeorol. 2006 Jul;50(6):349-57. doi: 10.1007/s00484-006-0032-0. Epub 2006 May 9. Int J Biometeorol. 2006. PMID: 16683118
-
Optimal photosynthetic use of light by tropical tree crowns achieved by adjustment of individual leaf angles and nitrogen content.Ann Bot. 2009 Mar;103(5):795-805. doi: 10.1093/aob/mcn265. Epub 2009 Jan 16. Ann Bot. 2009. PMID: 19151040 Free PMC article.
-
Integration of biological and information technologies to enhance plant autoluminescence.Plant Cell. 2024 Nov 2;36(11):4703-4715. doi: 10.1093/plcell/koae236. Plant Cell. 2024. PMID: 39167833 Free PMC article.
-
Contributions of leaf photosynthetic capacity, leaf angle and self-shading to the maximization of net photosynthesis in Acer saccharum: a modelling assessment.Ann Bot. 2012 Aug;110(3):731-41. doi: 10.1093/aob/mcs106. Epub 2012 Jun 4. Ann Bot. 2012. PMID: 22665700 Free PMC article.
References
-
- BangeMP, Hammer GL, Rickert KG.1997. Effect of radiation environment on radiation use efficiency and growth of sunflower. Crop Science 37: 1208–1214.
-
- Charles‐EdwardsDA.1982.Physiological determinants of crop growth. Sydney: Academic Press.
-
- CooperJP.1970. Potential production and energy conversion in temperate and tropical grasses. Herbage Abstracts 40: 1–13.
-
- DePuryDGG, Farquhar GD.1999. A commentary on the use of a sun/shade model to scale from the leaf to a canopy. Agricultural and Forest Meteorology 95: 257–260.
-
- DewarRC.1996. The correlation between plant growth and intercepted radiation: an interpretation in terms of optimal plant nitrogen content. Annals of Botany 78: 125–136.

