

Dielectric self-energy in Poisson-Boltzmann and Poisson-Nernst-Planck models of ion channels
- PMID: 12770869
- PMCID: PMC1302945
- DOI: 10.1016/S0006-3495(03)75091-7
Dielectric self-energy in Poisson-Boltzmann and Poisson-Nernst-Planck models of ion channels
Abstract
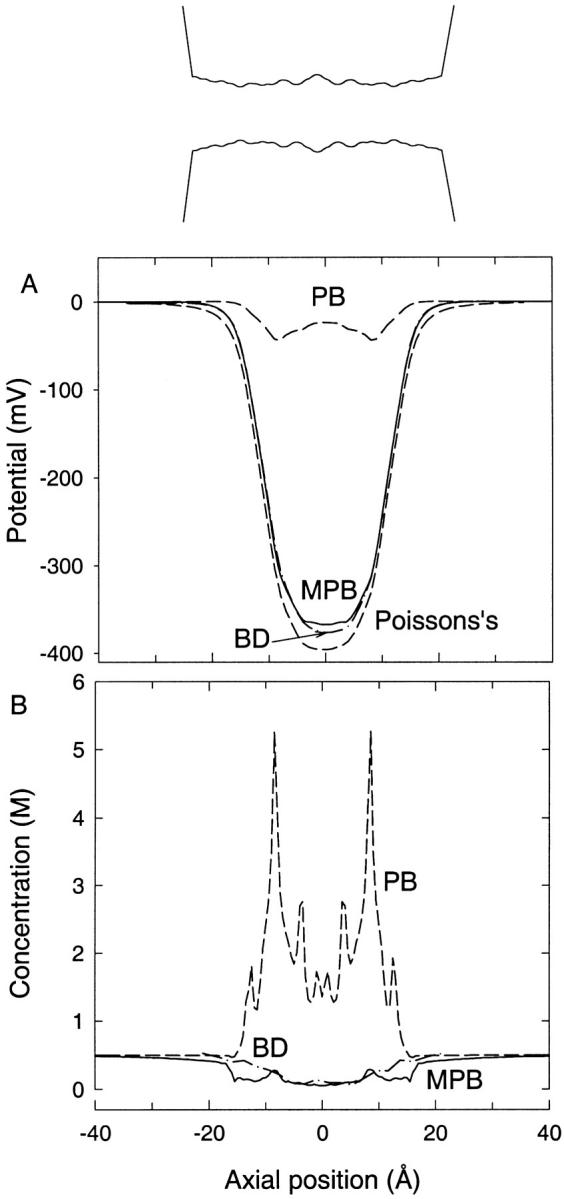
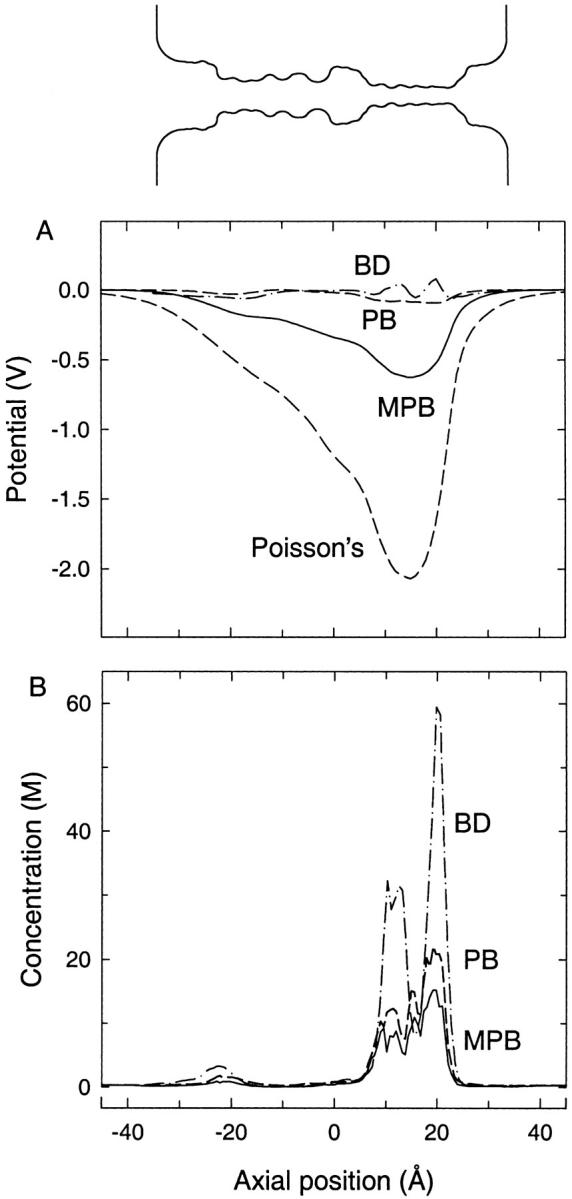
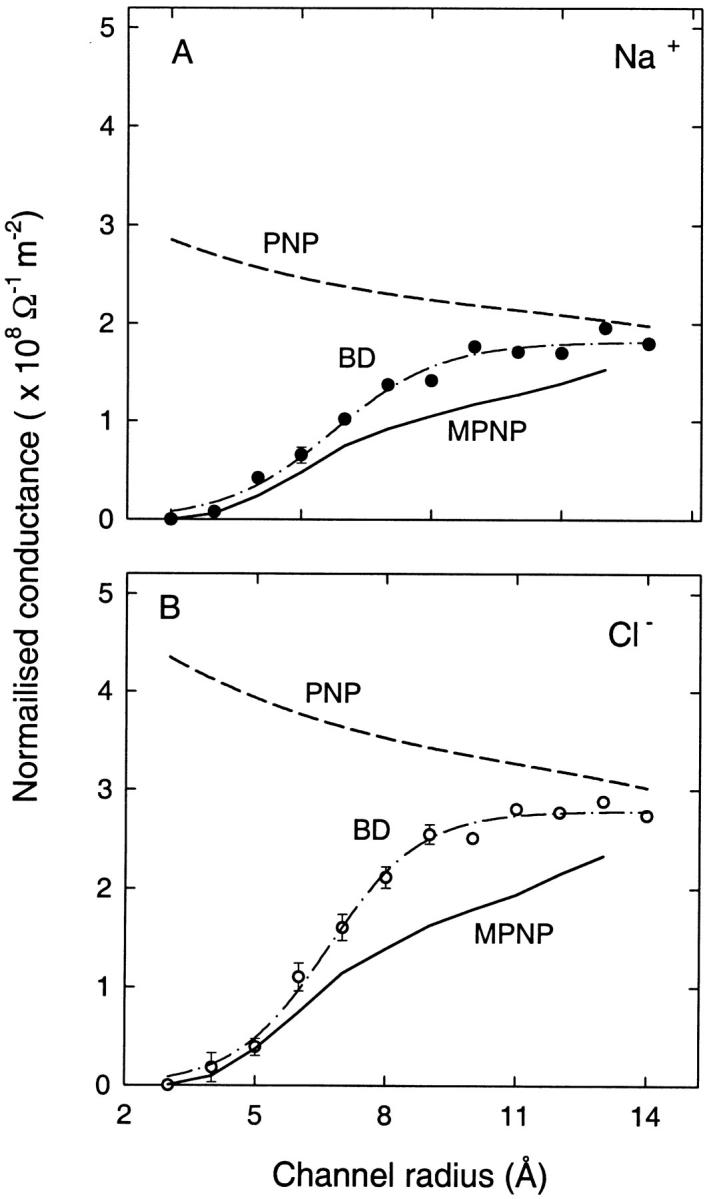
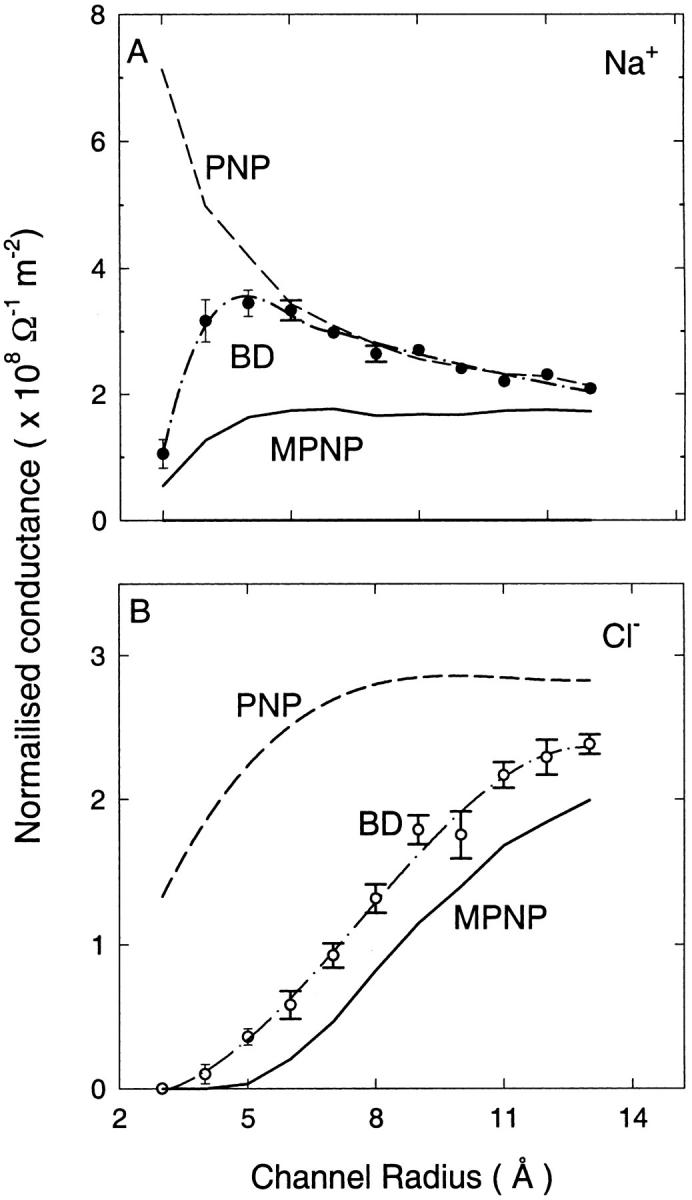
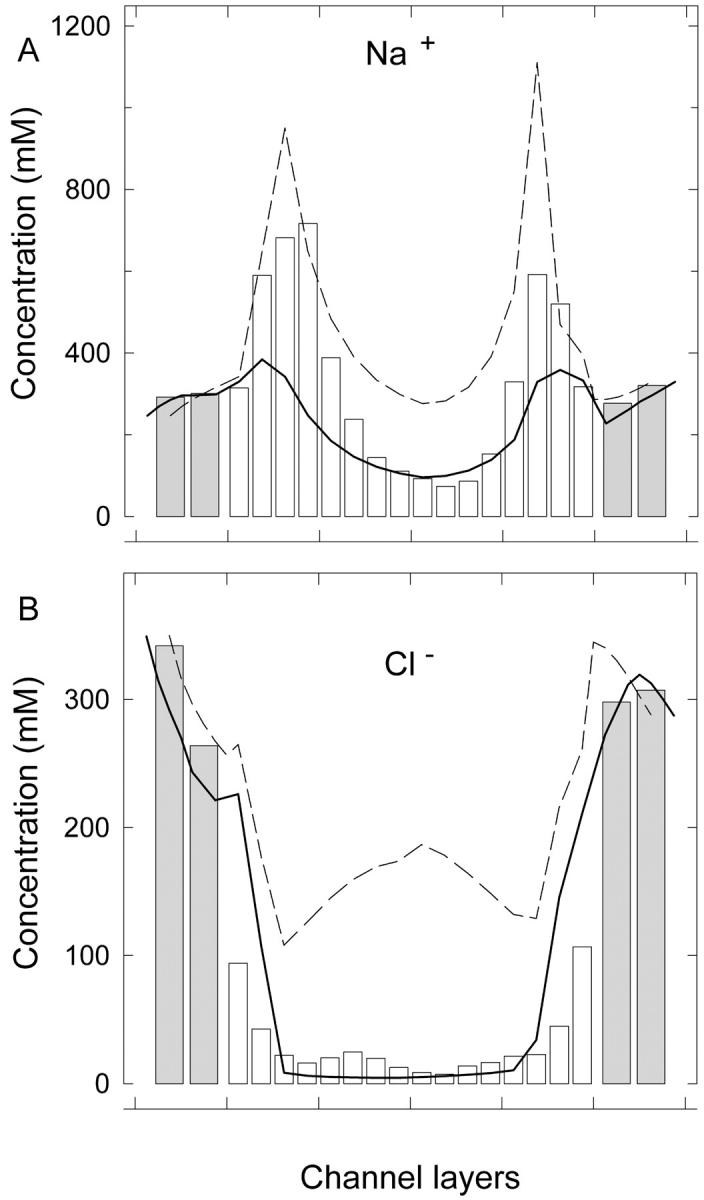
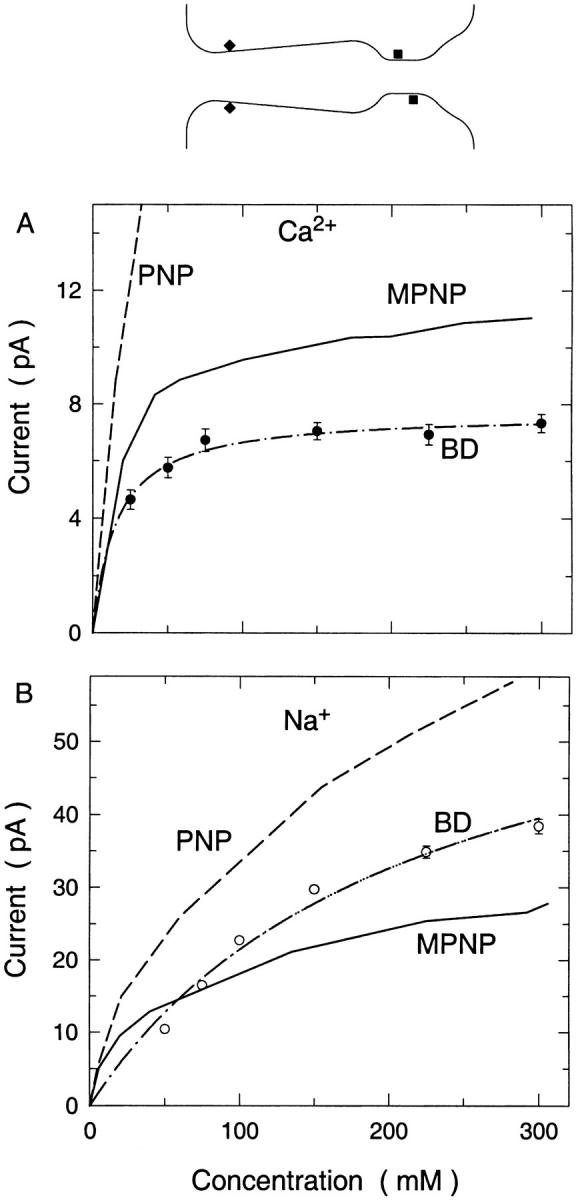
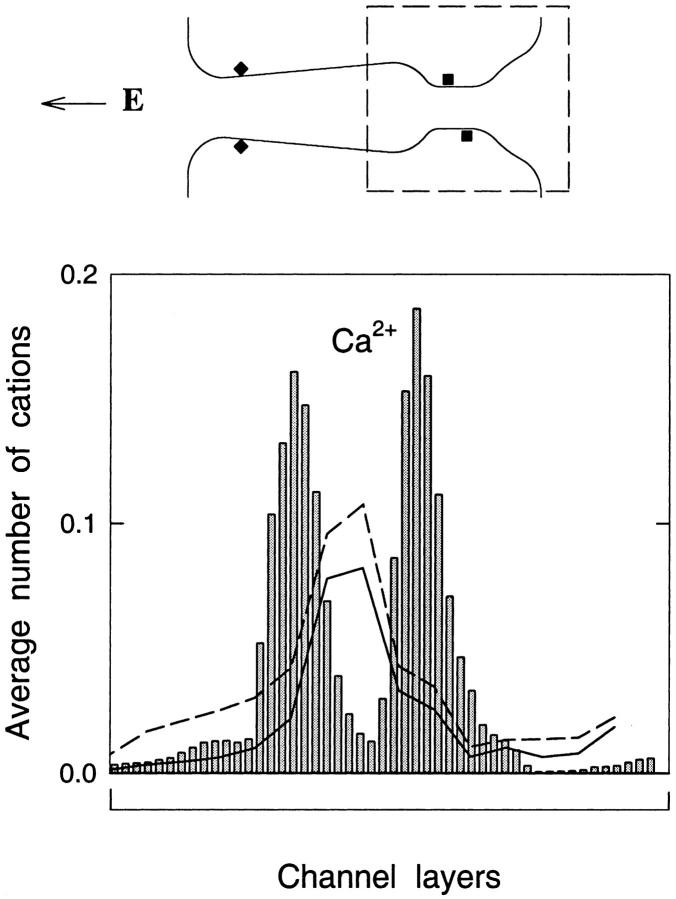
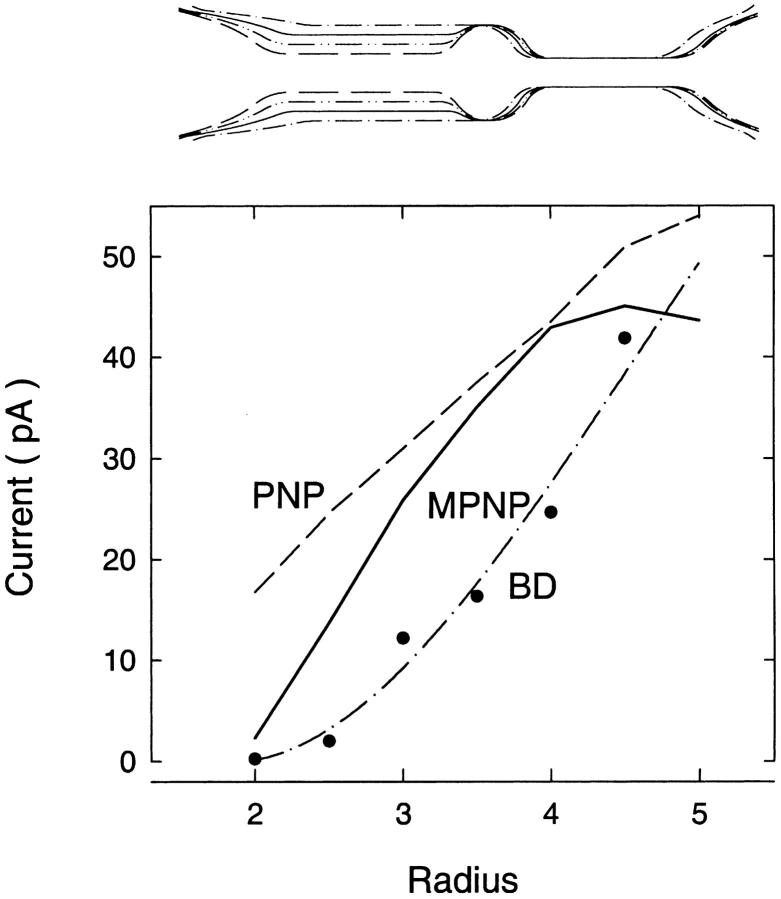
We demonstrated previously that the two continuum theories widely used in modeling biological ion channels give unreliable results when the radius of the conduit is less than two Debye lengths. The reason for this failure is the neglect of surface charges on the protein wall induced by permeating ions. Here we attempt to improve the accuracy of the Poisson-Boltzmann and Poisson-Nernst-Planck theories, when applied to channel-like environments, by including a specific dielectric self-energy term to overcome spurious shielding effects inherent in these theories. By comparing results with Brownian dynamics simulations, we show that the inclusion of an additional term in the equations yields significant qualitative improvements. The modified theories perform well in very wide and very narrow channels, but are less successful at intermediate sizes. The situation is worse in multi-ion channels because of the inability of the continuum theories to handle the ion-to-ion interactions correctly. Thus, further work is required if these continuum theories are to be reliably salvaged for quantitative studies of biological ion channels in all situations.
Figures
Similar articles
-
Molecular Mean-Field Theory of Ionic Solutions: A Poisson-Nernst-Planck-Bikerman Model.Entropy (Basel). 2020 May 14;22(5):550. doi: 10.3390/e22050550. Entropy (Basel). 2020. PMID: 33286322 Free PMC article. Review.
-
The role of the dielectric barrier in narrow biological channels: a novel composite approach to modeling single-channel currents.Biophys J. 2003 Jun;84(6):3646-61. doi: 10.1016/S0006-3495(03)75095-4. Biophys J. 2003. PMID: 12770873 Free PMC article.
-
Tests of continuum theories as models of ion channels. II. Poisson-Nernst-Planck theory versus brownian dynamics.Biophys J. 2000 May;78(5):2364-81. doi: 10.1016/S0006-3495(00)76781-6. Biophys J. 2000. PMID: 10777733 Free PMC article.
-
Tests of continuum theories as models of ion channels. I. Poisson-Boltzmann theory versus Brownian dynamics.Biophys J. 2000 May;78(5):2349-63. doi: 10.1016/S0006-3495(00)76780-4. Biophys J. 2000. PMID: 10777732 Free PMC article.
-
Interpretation of biological ion channel flux data--reaction-rate versus continuum theory.Annu Rev Biophys Biophys Chem. 1986;15:29-57. doi: 10.1146/annurev.bb.15.060186.000333. Annu Rev Biophys Biophys Chem. 1986. PMID: 2424476 Review.
Cited by
-
Dynamics of voltage profile in enzymatic ion transporters, demonstrated in electrokinetics of proton pumping rhodopsin.Biophys J. 2008 Dec;95(11):5005-13. doi: 10.1529/biophysj.107.125260. Epub 2008 Jul 11. Biophys J. 2008. PMID: 18621842 Free PMC article.
-
Computational methods and theory for ion channel research.Adv Phys X. 2022;7(1):2080587. doi: 10.1080/23746149.2022.2080587. Adv Phys X. 2022. PMID: 35874965 Free PMC article.
-
Molecular Mean-Field Theory of Ionic Solutions: A Poisson-Nernst-Planck-Bikerman Model.Entropy (Basel). 2020 May 14;22(5):550. doi: 10.3390/e22050550. Entropy (Basel). 2020. PMID: 33286322 Free PMC article. Review.
-
Variational multiscale models for charge transport.SIAM Rev Soc Ind Appl Math. 2012;54(4):699-754. doi: 10.1137/110845690. Epub 2012 Nov 8. SIAM Rev Soc Ind Appl Math. 2012. PMID: 23172978 Free PMC article.
-
A method for treating the passage of a charged hard sphere ion as it passes through a sharp dielectric boundary.J Chem Phys. 2011 Aug 14;135(6):064105. doi: 10.1063/1.3622857. J Chem Phys. 2011. PMID: 21842924 Free PMC article.
References
-
- Assad, F., K. Banoo, and M. Lundstrom. 1998. The drift-diffusion equation revisited. Sol. Sta. Electron. 42:283–295.
-
- Boda, B., D. Henderson, and D. D. Busath. 2002. Monte Carlo study of the selectivity of calcium channels: improved geometrical model. Mol. Phys. 100:2361–2368.
-
- Cheng, W., C. X. Wang, W. Z. Chen, Y. W. Xu, and Y. Y. Shi. 1998. Investigating the dielectric effects of channel pore water on the electrostatic barriers of the permeation ion by the finite difference Poisson-Boltzmann method. Eur. Biophys. J. 27:105–112. - PubMed
Publication types
MeSH terms
Substances
LinkOut - more resources
Full Text Sources
