

The role of the dielectric barrier in narrow biological channels: a novel composite approach to modeling single-channel currents
- PMID: 12770873
- PMCID: PMC1302949
- DOI: 10.1016/S0006-3495(03)75095-4
The role of the dielectric barrier in narrow biological channels: a novel composite approach to modeling single-channel currents
Abstract
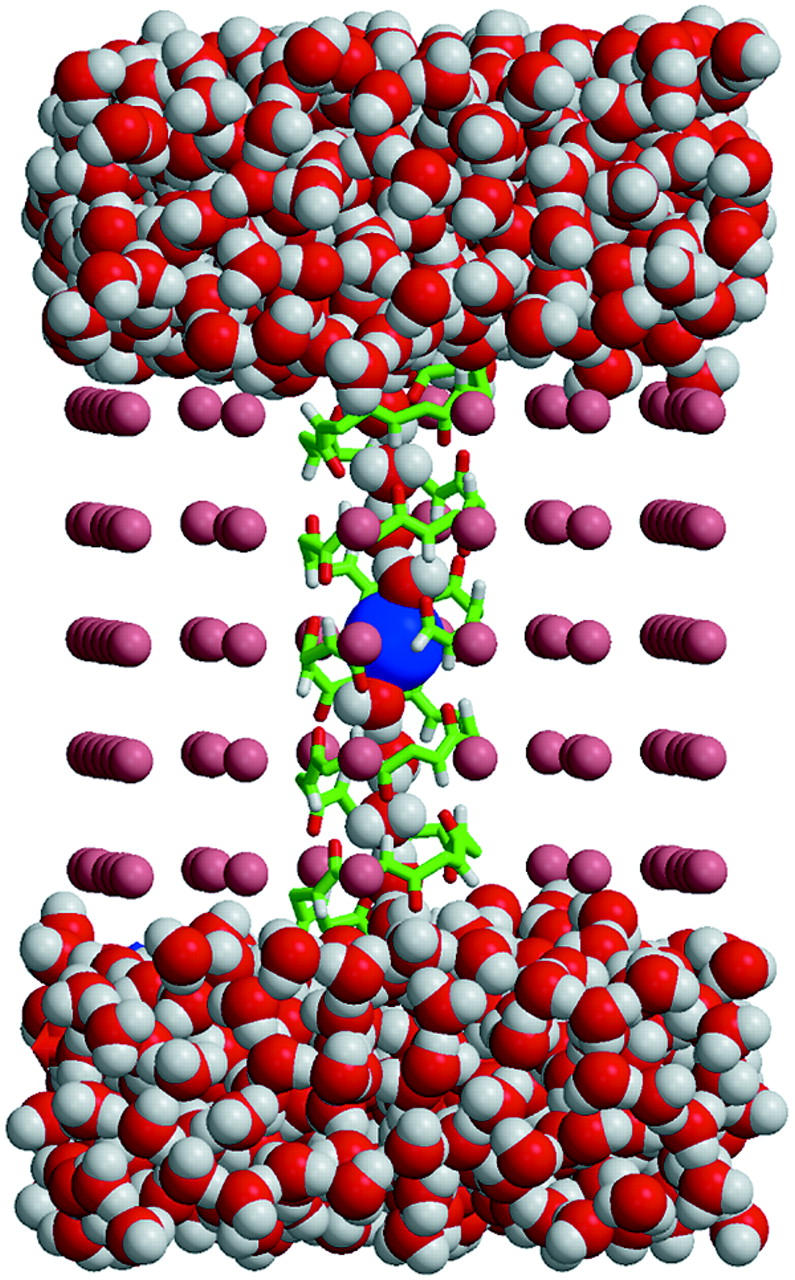
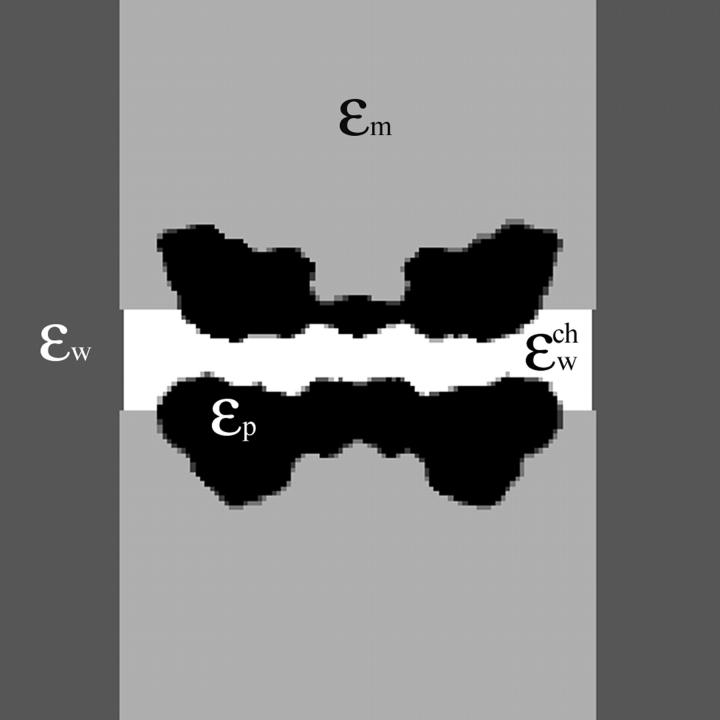
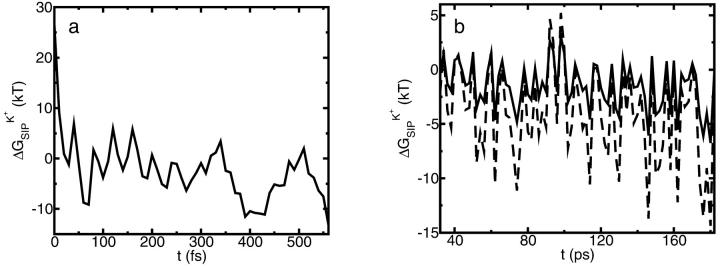
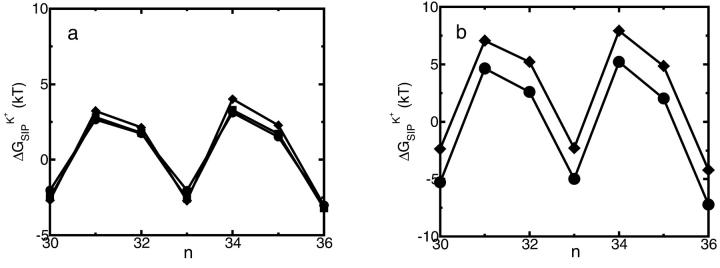
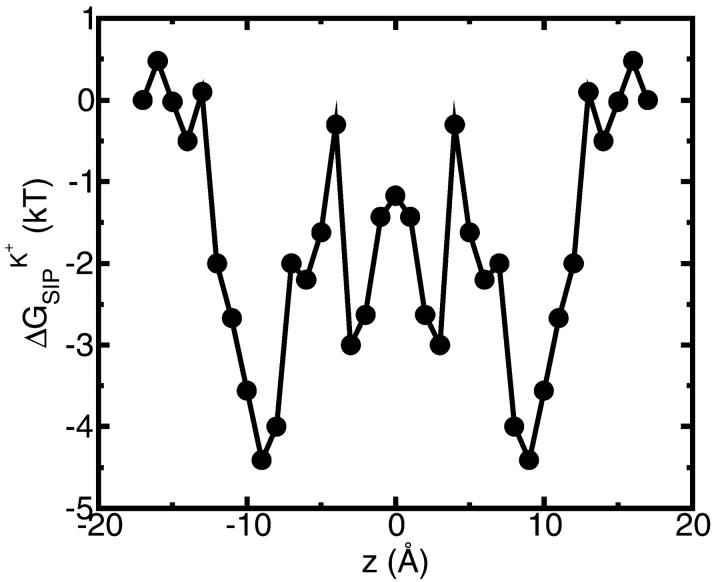
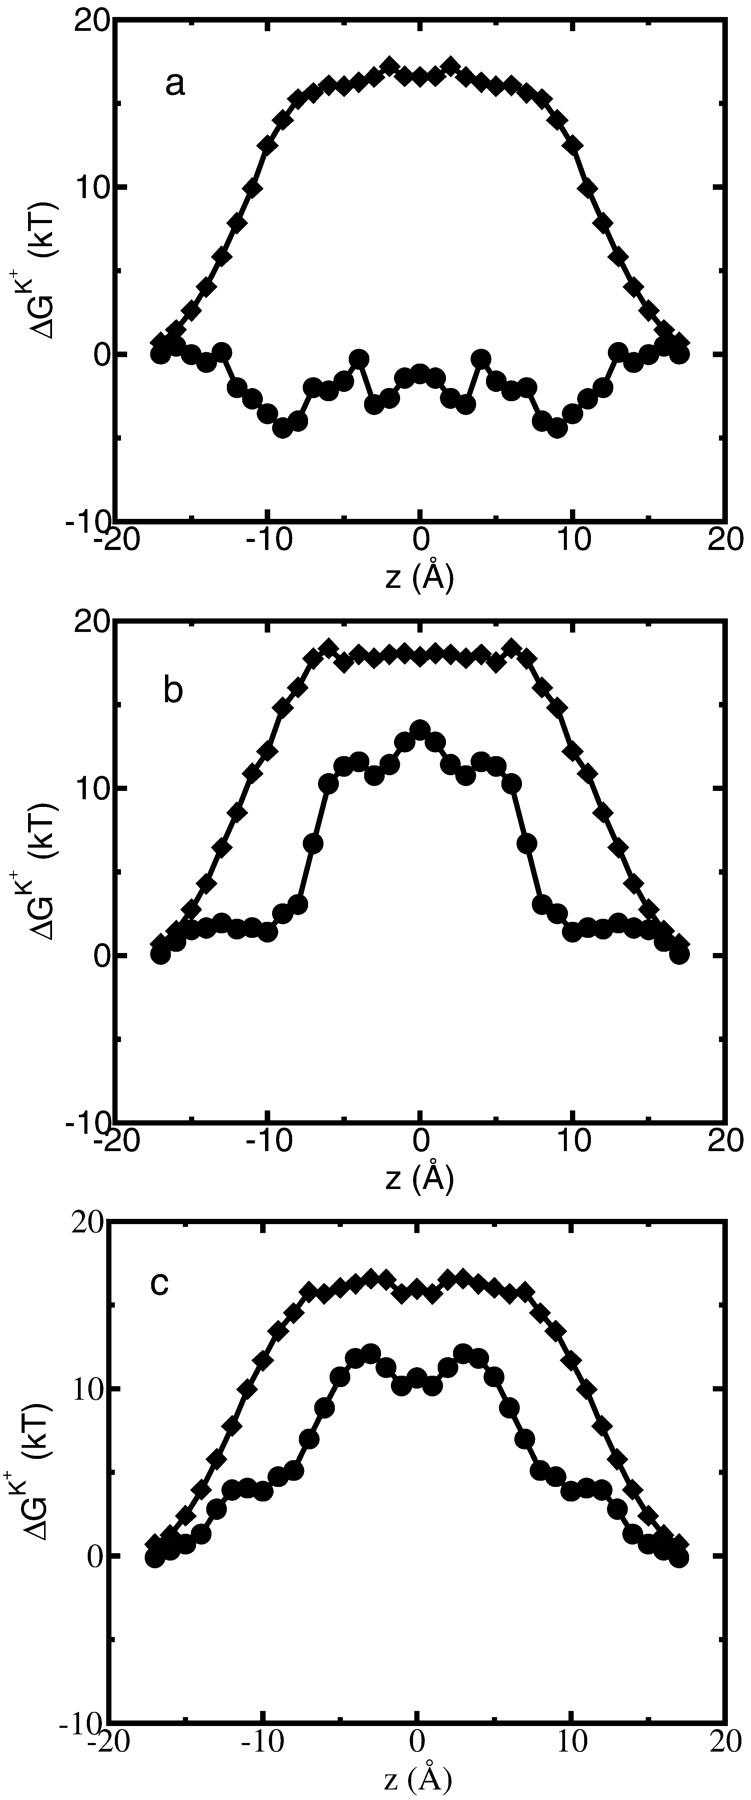
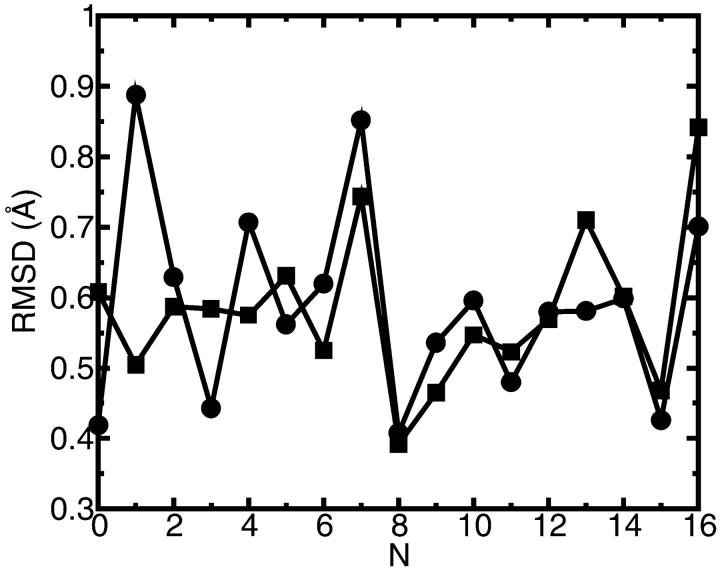
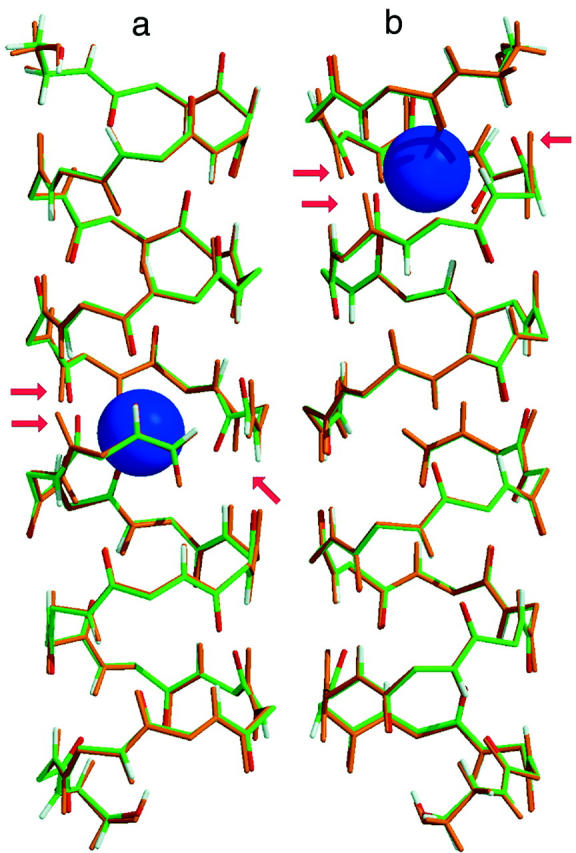
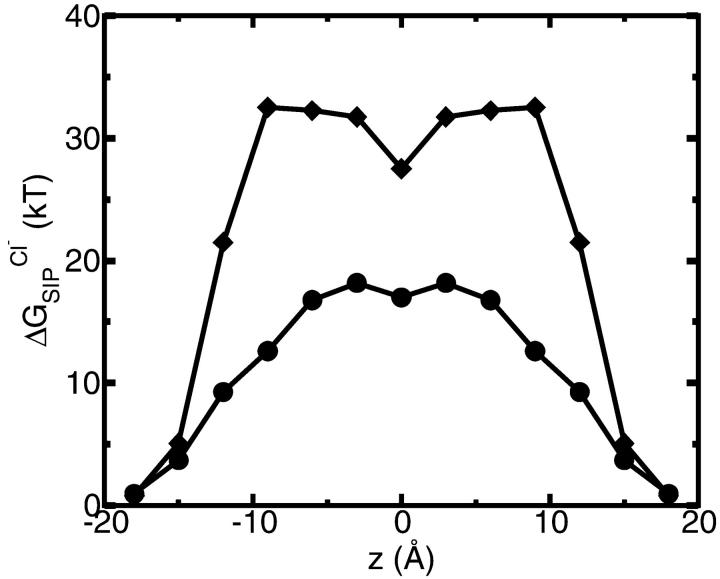
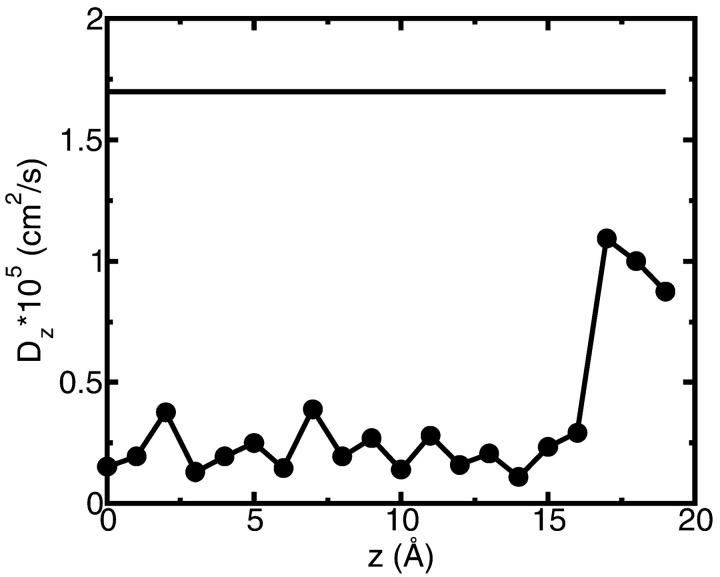
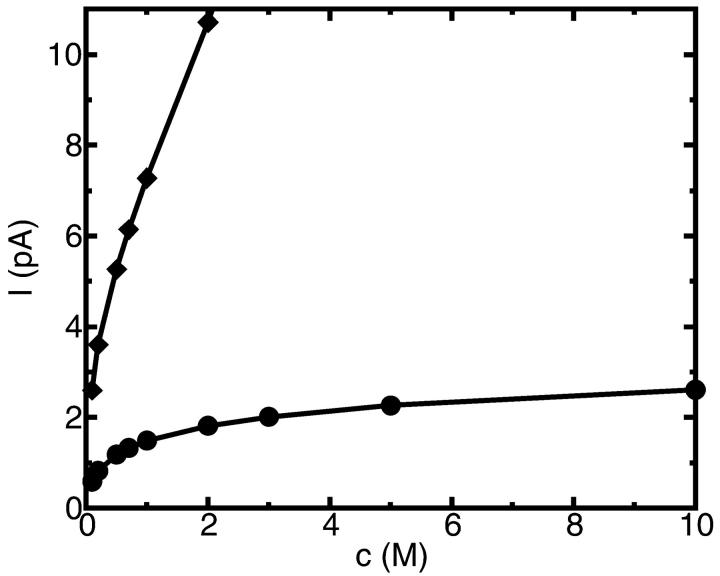
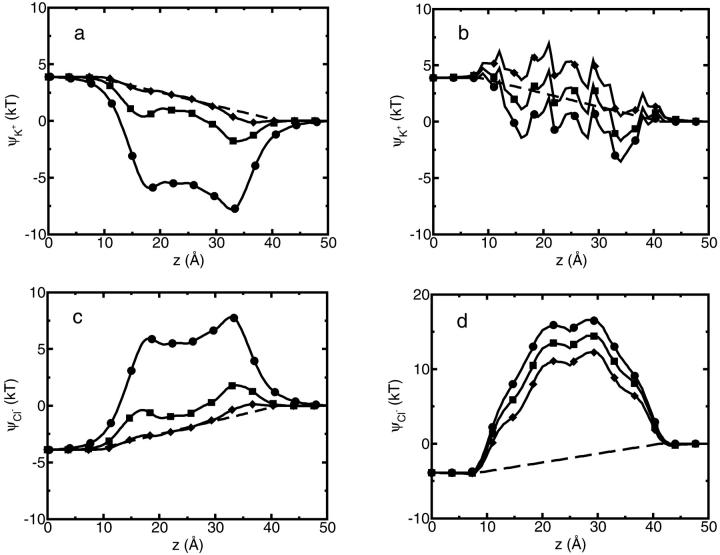
A composite continuum theory for calculating ion current through a protein channel of known structure is proposed, which incorporates information about the channel dynamics. The approach is utilized to predict current through the Gramicidin A ion channel, a narrow pore in which the applicability of conventional continuum theories is questionable. The proposed approach utilizes a modified version of Poisson-Nernst-Planck (PNP) theory, termed Potential-of-Mean-Force-Poisson-Nernst-Planck theory (PMFPNP), to compute ion currents. As in standard PNP, ion permeation is modeled as a continuum drift-diffusion process in a self-consistent electrostatic potential. In PMFPNP, however, information about the dynamic relaxation of the protein and the surrounding medium is incorporated into the model of ion permeation by including the free energy of inserting a single ion into the channel, i.e., the potential of mean force along the permeation pathway. In this way the dynamic flexibility of the channel environment is approximately accounted for. The PMF profile of the ion along the Gramicidin A channel is obtained by combining an equilibrium molecular dynamics (MD) simulation that samples dynamic protein configurations when an ion resides at a particular location in the channel with a continuum electrostatics calculation of the free energy. The diffusion coefficient of a potassium ion within the channel is also calculated using the MD trajectory. Therefore, except for a reasonable choice of dielectric constants, no direct fitting parameters enter into this model. The results of our study reveal that the channel response to the permeating ion produces significant electrostatic stabilization of the ion inside the channel. The dielectric self-energy of the ion remains essentially unchanged in the course of the MD simulation, indicating that no substantial changes in the protein geometry occur as the ion passes through it. Also, the model accounts for the experimentally observed saturation of ion current with increase of the electrolyte concentration, in contrast to the predictions of standard PNP theory.
Figures


Similar articles
-
Dielectric self-energy in Poisson-Boltzmann and Poisson-Nernst-Planck models of ion channels.Biophys J. 2003 Jun;84(6):3594-606. doi: 10.1016/S0006-3495(03)75091-7. Biophys J. 2003. PMID: 12770869 Free PMC article.
-
Poisson-Nernst-Planck theory approach to the calculation of current through biological ion channels.IEEE Trans Nanobioscience. 2005 Mar;4(1):81-93. doi: 10.1109/tnb.2004.842495. IEEE Trans Nanobioscience. 2005. PMID: 15816174
-
Role of protein flexibility in ion permeation: a case study in gramicidin A.Biophys J. 2006 Apr 1;90(7):2285-96. doi: 10.1529/biophysj.105.073205. Epub 2006 Jan 13. Biophys J. 2006. PMID: 16415054 Free PMC article.
-
Permeation in ion channels: the interplay of structure and theory.Trends Neurosci. 2004 Jun;27(6):308-14. doi: 10.1016/j.tins.2004.03.013. Trends Neurosci. 2004. PMID: 15165734 Review.
-
The gramicidin ion channel: a model membrane protein.Biochim Biophys Acta. 2007 Sep;1768(9):2011-25. doi: 10.1016/j.bbamem.2007.05.011. Epub 2007 May 18. Biochim Biophys Acta. 2007. PMID: 17572379 Review.
Cited by
-
Variational multiscale models for charge transport.SIAM Rev Soc Ind Appl Math. 2012;54(4):699-754. doi: 10.1137/110845690. Epub 2012 Nov 8. SIAM Rev Soc Ind Appl Math. 2012. PMID: 23172978 Free PMC article.
-
Influence of protein flexibility on the electrostatic energy landscape in gramicidin A.Eur Biophys J. 2005 May;34(3):208-16. doi: 10.1007/s00249-004-0442-z. Epub 2004 Nov 5. Eur Biophys J. 2005. PMID: 15536565
-
Quantum dynamics in continuum for proton transport--generalized correlation.J Chem Phys. 2012 Apr 7;136(13):134109. doi: 10.1063/1.3698598. J Chem Phys. 2012. PMID: 22482542 Free PMC article.
-
Computing numerically the access resistance of a pore.Eur Biophys J. 2005 Jun;34(4):314-22. doi: 10.1007/s00249-004-0452-x. Epub 2005 Mar 9. Eur Biophys J. 2005. PMID: 15756588
-
Energy variational analysis of ions in water and channels: Field theory for primitive models of complex ionic fluids.J Chem Phys. 2010 Sep 14;133(10):104104. doi: 10.1063/1.3476262. J Chem Phys. 2010. PMID: 20849161 Free PMC article.
References
-
- Allen, T. W., M. Hoyles, S. Kuyucak, and S. H. Chung. 1999. Molecular and Brownian dynamics study of ion selectivity and conductivity in the potassium channel. Chem. Phys. Let. 313:358–365.
-
- Andersen, O. S., and R. E. Koeppe, II. 1992. Molecular determinants of channel function. Physiol. Rev. 72:S89–S158. - PubMed
-
- Antonov, S. M. 2001. Transporters of neurotransmitters: receptive, transport, and channel functions. J. Evol. Biochem. Physiol. 37:328–334.
-
- Aqvist, J. 1990. Ion water interaction potentials derived from free-energy perturbation simulations. J. Phys. Chem. 94:8021–8024.
Publication types
MeSH terms
Substances
Grants and funding
LinkOut - more resources
Full Text Sources
Medical
Research Materials
Miscellaneous
