

Structural studies of MS2 bacteriophage virus particle disassembly by nuclear magnetic resonance relaxation measurements
- PMID: 12770895
- PMCID: PMC1302971
- DOI: 10.1016/S0006-3495(03)75117-0
Structural studies of MS2 bacteriophage virus particle disassembly by nuclear magnetic resonance relaxation measurements
Abstract
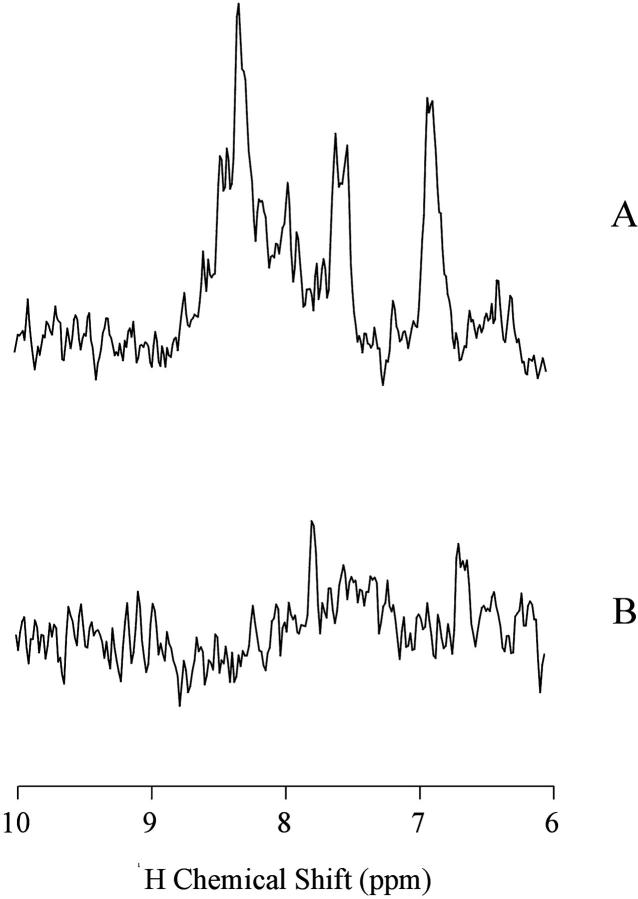
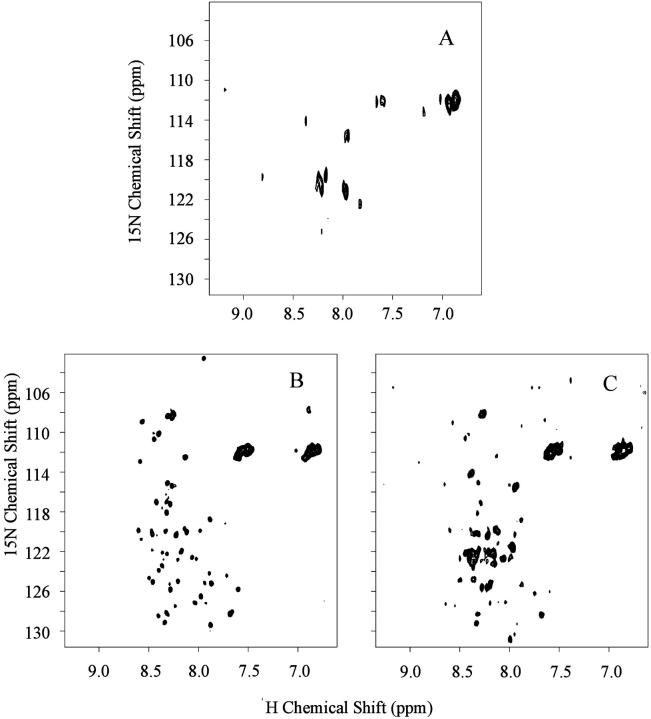
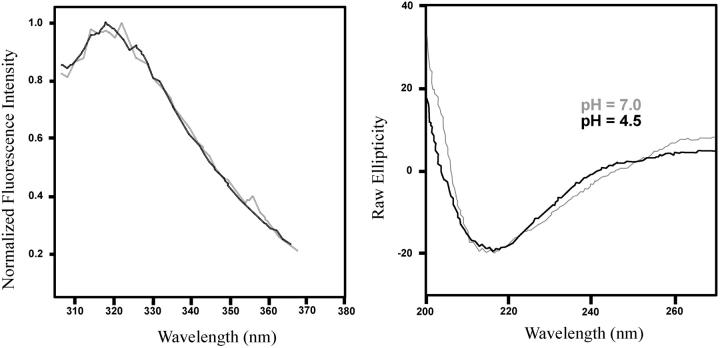
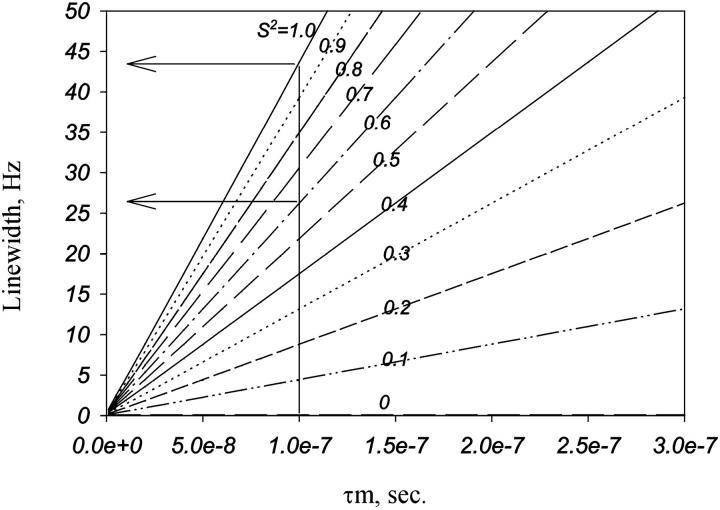
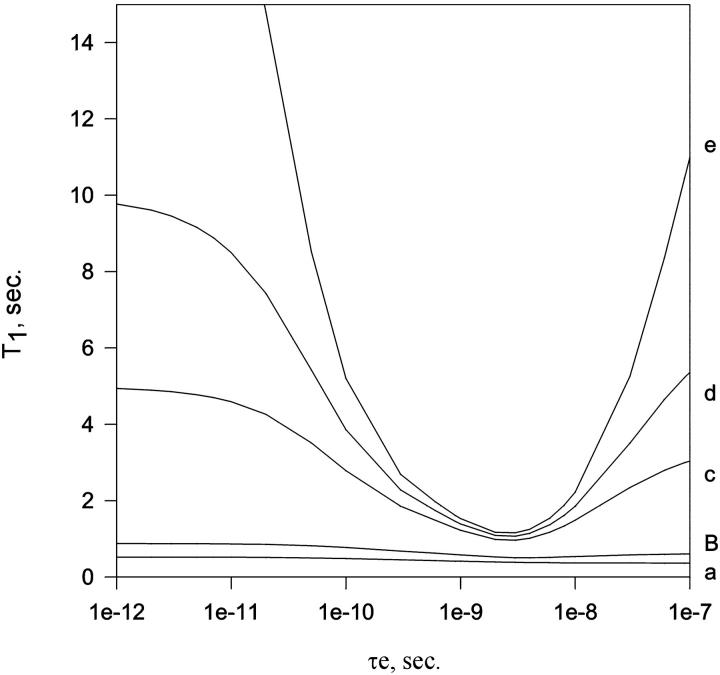
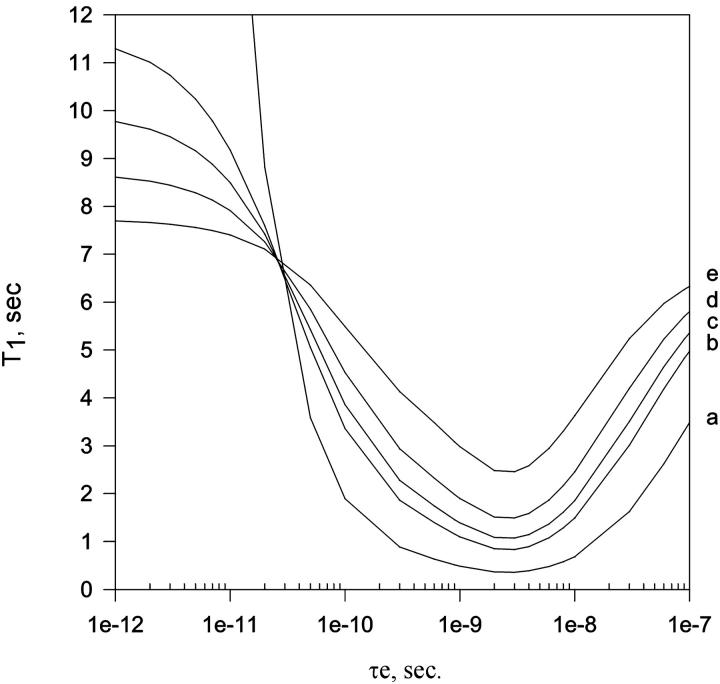
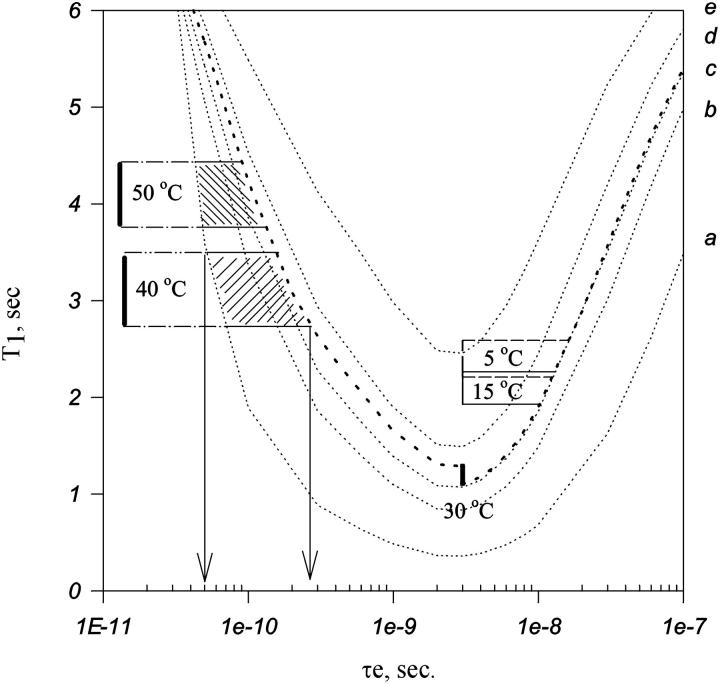
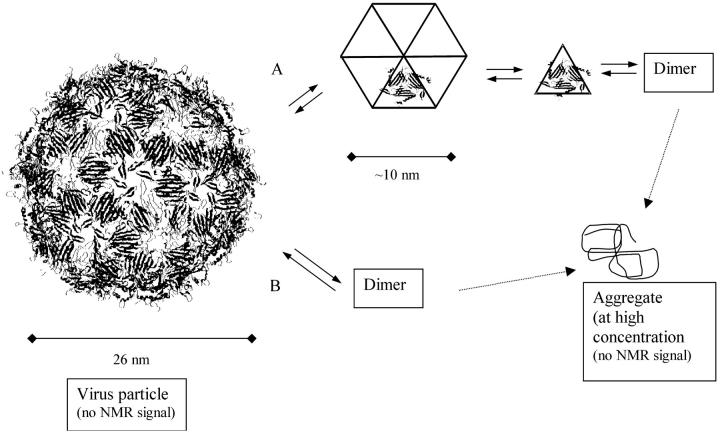
In this article we studied, by nuclear magnetic resonance relaxation measurements, the disassembly of a virus particle-the MS2 bacteriophage. MS2 is one of the single-stranded RNA bacteriophages that infect Escherichia coli. At pH 4.5, the phage turns to a metastable state, as is indicated by an increase in the observed nuclear magnetic resonance signal intensity upon decreasing the pH from 7.0 to 4.5. Steady-state fluorescence and circular dichroism spectra at pH 4.5 show that the difference in conformation and secondary structure is not pronounced if compared with the phage at pH 7.0. At pH 4.5, two-dimensional (15)N-(1)H heteronuclear multiple quantum coherence (HMQC) spectrum shows approximately 40 crosspeaks, corresponding to the most mobile residues of MS2 coat protein at pH 4.5. The (15)N linewidth is approximately 30 Hz, which is consistent with an intermediate with a rotational relaxation time of 100 ns. The average spin lattice relaxation time (T(1)) of the mobile residues was measured at different temperatures, clearly distinguishing between the dimer and the equilibrium intermediate. The results show, for the first time, the presence of intermediates in the process of dissociation of the MS2 bacteriophage.
Figures
Similar articles
-
The MS2 coat protein shell is likely assembled under tension: a novel role for the MS2 bacteriophage A protein as revealed by small-angle neutron scattering.J Mol Biol. 2006 Feb 3;355(5):1095-111. doi: 10.1016/j.jmb.2005.11.040. Epub 2005 Dec 1. J Mol Biol. 2006. PMID: 16359706
-
The three-dimensional structure of genomic RNA in bacteriophage MS2: implications for assembly.J Mol Biol. 2008 Jan 18;375(3):824-36. doi: 10.1016/j.jmb.2007.08.067. Epub 2007 Sep 7. J Mol Biol. 2008. PMID: 18048058
-
The crystal structure of bacteriophage GA and a comparison of bacteriophages belonging to the major groups of Escherichia coli leviviruses.J Mol Biol. 1997 Sep 5;271(5):759-73. doi: 10.1006/jmbi.1997.1214. J Mol Biol. 1997. PMID: 9299325
-
[Interaction of RNA-containing bacteriophages with the host cells: MS2-induced E. coli mutants and formation of DNA-containing derivatives of MS2 bacteriophage].Tsitol Genet. 2008 Jan-Feb;42(1):73-90. Tsitol Genet. 2008. PMID: 18411761 Review. Russian.
-
Cross-correlated relaxation for measurement of angles between tensorial interactions.Methods Enzymol. 2001;338:35-81. doi: 10.1016/s0076-6879(02)38215-6. Methods Enzymol. 2001. PMID: 11460558 Review. No abstract available.
Cited by
-
Phage engineering and the evolutionary arms race.Curr Opin Biotechnol. 2021 Apr;68:23-29. doi: 10.1016/j.copbio.2020.09.009. Epub 2020 Oct 23. Curr Opin Biotechnol. 2021. PMID: 33113495 Free PMC article. Review.
-
pyCapsid: identifying dominant dynamics and quasi-rigid mechanical units in protein shells.Bioinformatics. 2024 Jan 2;40(1):btad761. doi: 10.1093/bioinformatics/btad761. Bioinformatics. 2024. PMID: 38113434 Free PMC article.
-
Disassembly of Virus-Like Particles and the Stabilizing Role of the Nucleic Acid Cargo.J Phys Chem B. 2025 Feb 6;129(5):1516-1528. doi: 10.1021/acs.jpcb.4c07215. Epub 2025 Jan 22. J Phys Chem B. 2025. PMID: 39841546
References
-
- Akke, M., and A. G. Palmer. 1996. Monitoring macromolecular motions on microsecond to millisecond time scales by R(1), Rho R(1) constant relaxation time NMR spectroscopy J. Am. Chem. Soc. 118:911–912.
-
- Almeida, F. C., and S. J. Opella. 1997a. Measurement of 1H T1ρ in a uniformly 15N labeled protein with heteronuclear two-dimensional spectroscopy. J. Magn. Res. 124:509–511. - PubMed
-
- Almeida, F. C., and S. J. Opella. 1997b. FD coat protein structure in membrane environments: structural dynamics of the loop between the hydrophobic trans membrane helix and the amphipathic in-plane helix. J. Mol. Biol. 270:481–495. - PubMed
-
- Atkins, P. W., editor. 1997. Physical Chemistry, 6th Ed. W. H. Freeman & Co., London.
-
- Axblom, C., K. Tars, K. Fridborg, L. Oma, M. Bundule, and L. Liljas. 1998. Structure of phage FR capsids with deletion in the FG loop: implications for viral assembly. Virology. 249:80–88. - PubMed
Publication types
MeSH terms
Substances
LinkOut - more resources
Full Text Sources
Miscellaneous
