

A measure of conformational entropy change during thermal protein unfolding using neutron spectroscopy
- PMID: 12770898
- PMCID: PMC1302974
- DOI: 10.1016/S0006-3495(03)75120-0
A measure of conformational entropy change during thermal protein unfolding using neutron spectroscopy
Abstract
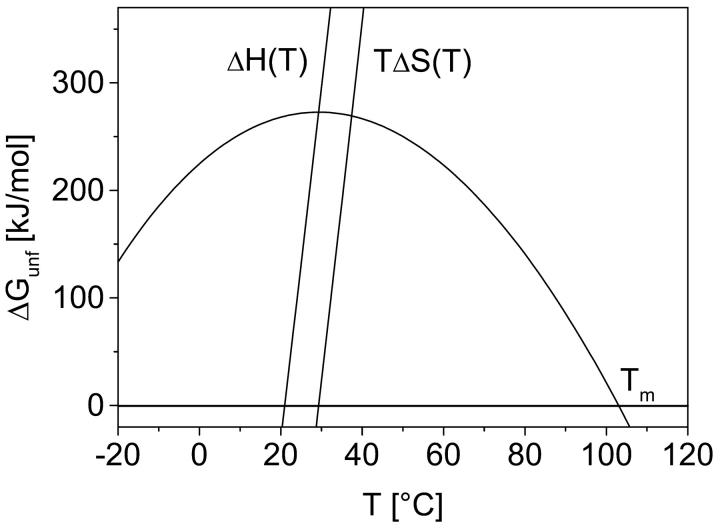
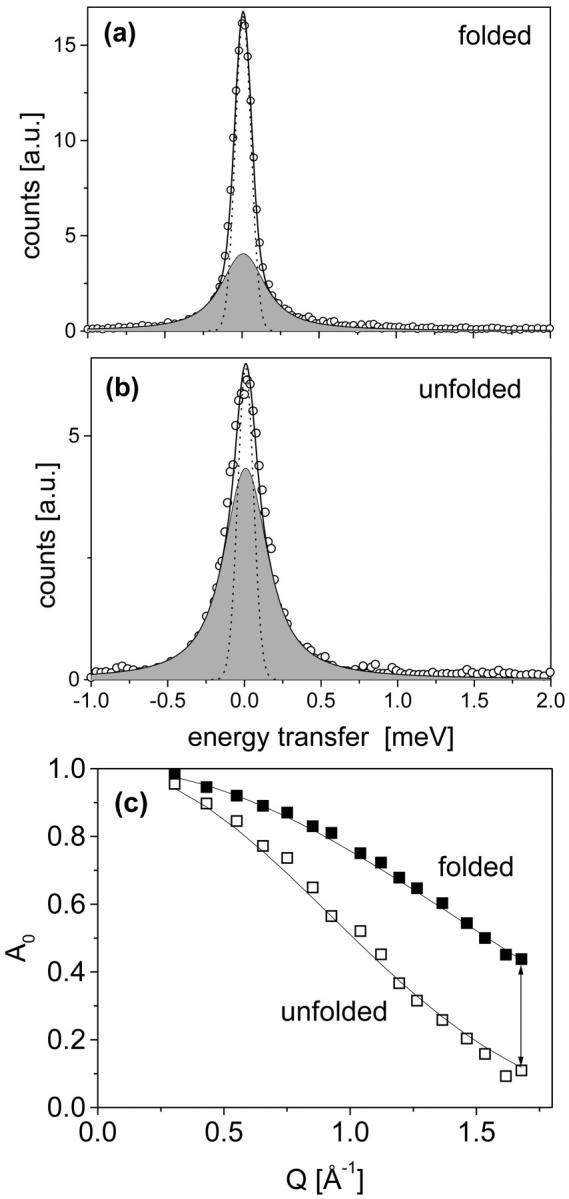
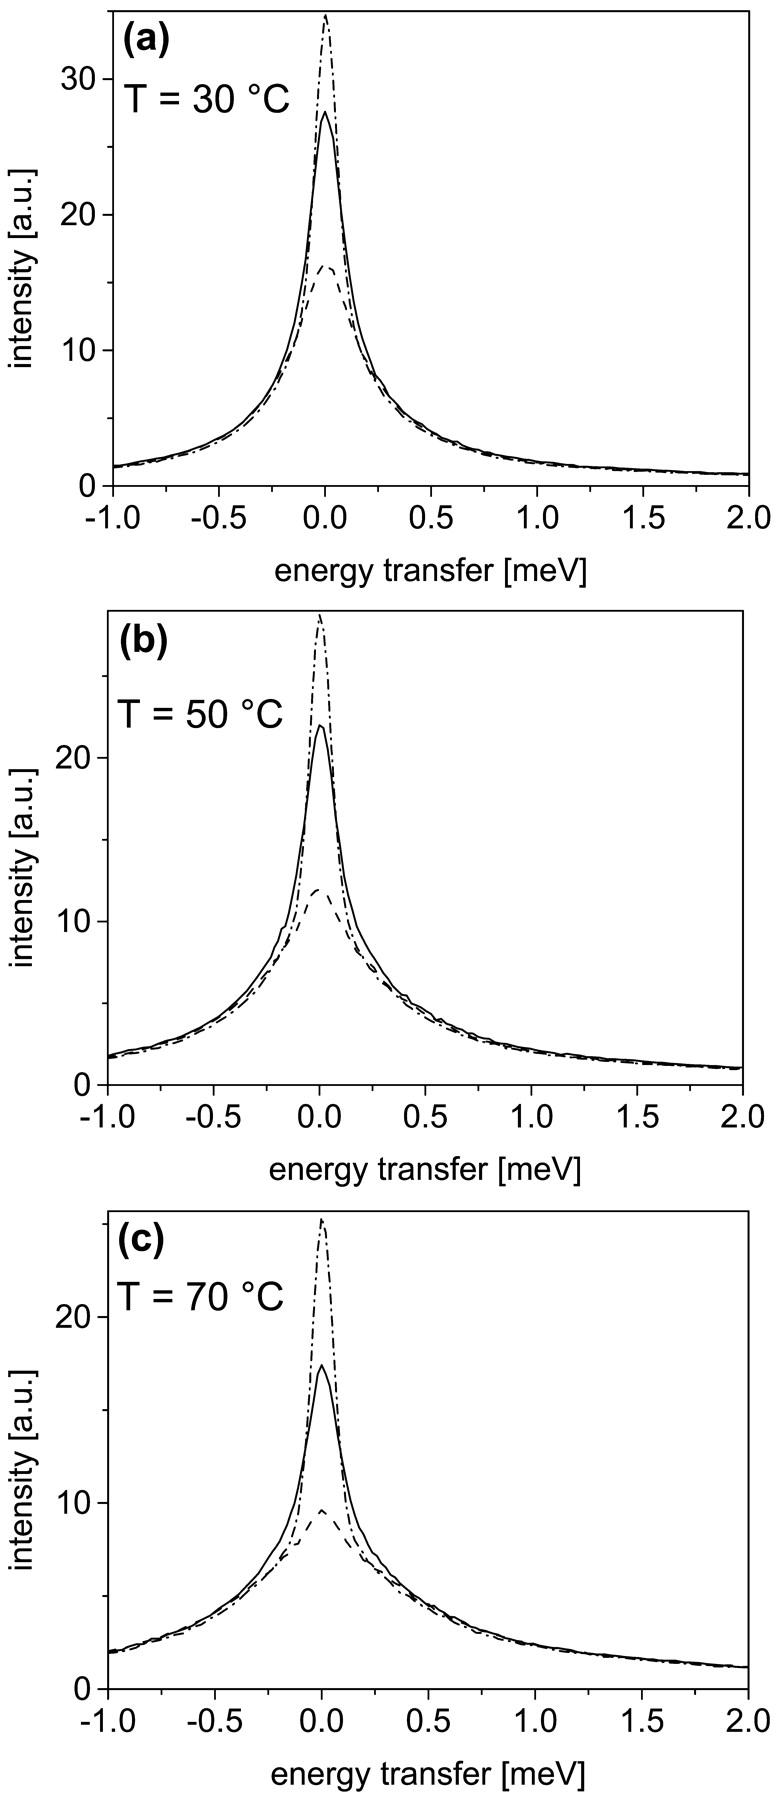
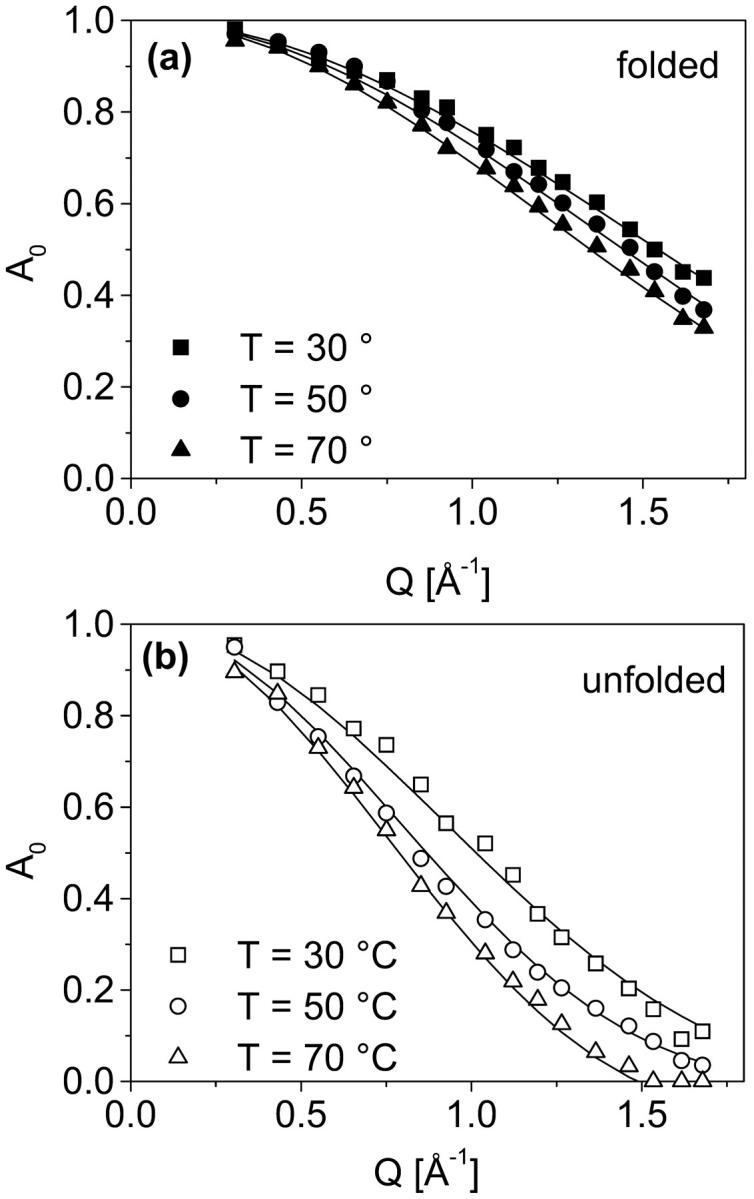
Thermal unfolding of proteins at high temperatures is caused by a strong increase of the entropy change which lowers Gibbs free energy change of the unfolding transition (DeltaG(unf) = DeltaH - TDeltaS). The main contributions to entropy are the conformational entropy of the polypeptide chain itself and ordering of water molecules around hydrophobic side chains of the protein. To elucidate the role of conformational entropy upon thermal unfolding in more detail, conformational dynamics in the time regime of picoseconds was investigated with neutron spectroscopy. Confined internal structural fluctuations were analyzed for alpha-amylase in the folded and the unfolded state as a function of temperature. A strong difference in structural fluctuations between the folded and the unfolded state was observed at 30 degrees C, which increased even more with rising temperatures. A simple analytical model was used to quantify the differences of the conformational space explored by the observed protein dynamics for the folded and unfolded state. Conformational entropy changes, calculated on the basis of the applied model, show a significant increase upon heating. In contrast to indirect estimates, which proposed a temperature independent conformational entropy change, the measurements presented here, demonstrated that the conformational entropy change increases with rising temperature and therefore contributes to thermal unfolding.
Figures
Similar articles
-
Structural stability and unfolding properties of thermostable bacterial alpha-amylases: a comparative study of homologous enzymes.Biochemistry. 2004 Aug 3;43(30):9589-99. doi: 10.1021/bi0493362. Biochemistry. 2004. PMID: 15274613
-
The nature of the free energy barriers to two-state folding.Proteins. 2004 Oct 1;57(1):142-52. doi: 10.1002/prot.20172. Proteins. 2004. PMID: 15326600
-
Thermal and urea-induced unfolding of the marginally stable lac repressor DNA-binding domain: a model system for analysis of solute effects on protein processes.Biochemistry. 2003 Feb 25;42(7):2202-17. doi: 10.1021/bi0270992. Biochemistry. 2003. PMID: 12590610
-
Proteins in action: the physics of structural fluctuations and conformational changes.Curr Opin Struct Biol. 2003 Oct;13(5):552-7. doi: 10.1016/j.sbi.2003.09.004. Curr Opin Struct Biol. 2003. PMID: 14568609 Review.
-
Rigidity versus flexibility: the dilemma of understanding protein thermal stability.FEBS J. 2015 Oct;282(20):3899-917. doi: 10.1111/febs.13343. Epub 2015 Jul 15. FEBS J. 2015. PMID: 26074325 Review.
Cited by
-
Conformational Entropy of an Ideal Cross-Linking Polymer Chain.Entropy (Basel). 2008 Sep 20;10(3):285-308. doi: 10.3390/e10030285. Entropy (Basel). 2008. PMID: 19777088 Free PMC article.
-
Dynamical Behavior of Human α-Synuclein Studied by Quasielastic Neutron Scattering.PLoS One. 2016 Apr 20;11(4):e0151447. doi: 10.1371/journal.pone.0151447. eCollection 2016. PLoS One. 2016. PMID: 27097022 Free PMC article.
-
How aggregation and conformational scrambling of unfolded states govern fluorescence emission spectra.Biophys J. 2006 May 15;90(10):3704-11. doi: 10.1529/biophysj.105.078980. Epub 2006 Feb 24. Biophys J. 2006. PMID: 16500981 Free PMC article.
-
Moving in the Right Direction: Protein Vibrations Steering Function.Biophys J. 2017 Mar 14;112(5):933-942. doi: 10.1016/j.bpj.2016.12.049. Biophys J. 2017. PMID: 28297652 Free PMC article.
-
On the Effect of Sodium Chloride and Sodium Sulfate on Cold Denaturation.PLoS One. 2015 Jul 21;10(7):e0133550. doi: 10.1371/journal.pone.0133550. eCollection 2015. PLoS One. 2015. PMID: 26197394 Free PMC article.
References
-
- Arnold, F. H., P. L. Wintrode, K. Miyazaki, and A. Gershenson. 2001. How enzymes adapt: lessons from directed evolution. Trends Biochem. Sci. 26:100–106. - PubMed
-
- Beadle, B. M., W. A. Baase, D. B. Wilson, N. R. Gilkes, and B. K. Shoichet. 1999. Comparing the thermodynamic stabilities of a related thermophilic and mesophilic enzyme. Biochemistry. 38:2570–2576. - PubMed
-
- Becker, R. 1985. Theorie der Wärme. Springer-Verlag, Berlin.
-
- Becktel, W. J., and J. A. Schellmann. 1987. Protein stability curves. Biopolymers. 26:1859–1877. - PubMed
Publication types
MeSH terms
Substances
LinkOut - more resources
Full Text Sources
