

Protein self-association in solution: the bovine pancreatic trypsin inhibitor decamer
- PMID: 12770900
- PMCID: PMC1302976
- DOI: 10.1016/S0006-3495(03)75122-4
Protein self-association in solution: the bovine pancreatic trypsin inhibitor decamer
Abstract
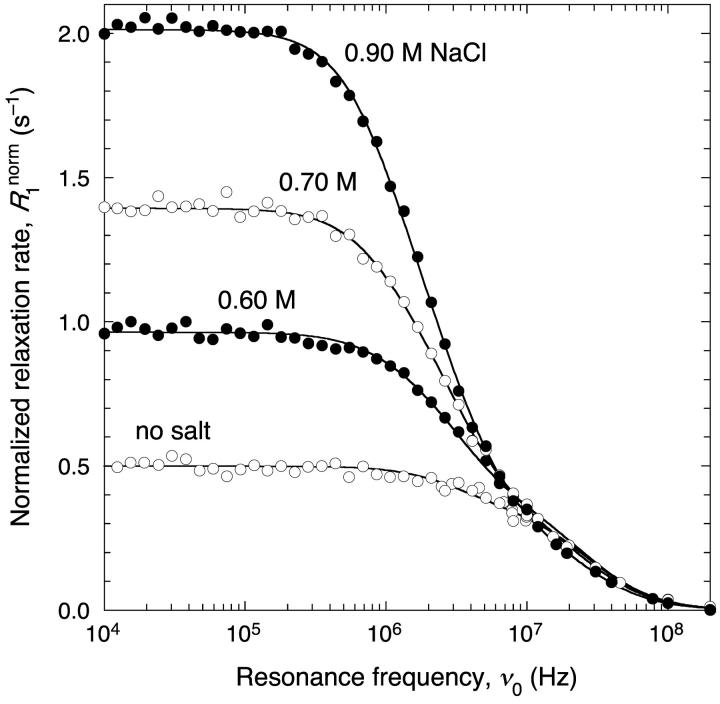
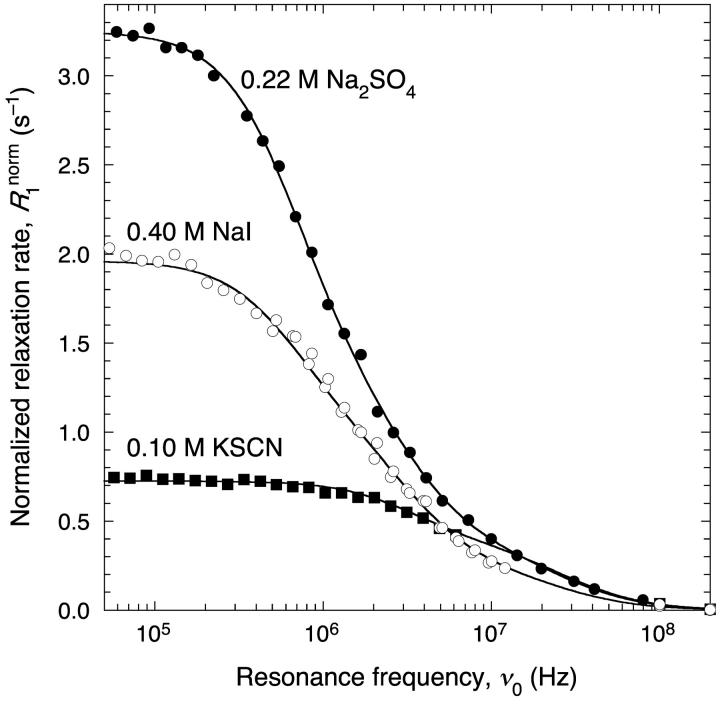
We have used magnetic relaxation dispersion to study bovine pancreatic trypsin inhibitor (BPTI) self-association as a function of pH, salt type and concentration, and temperature. The magnetic relaxation dispersion method sensitively detects stable oligomers without being affected by other interactions. We find that BPTI decamers form cooperatively under a wide range of solution conditions with no sign of dimers or other small oligomers. Decamer formation is opposed by electrostatic repulsion among numerous cationic residues confined within a narrow channel. Accordingly, the decamer population increases with increasing pH, as cationic residues are deprotonated, and with increasing salt concentration. The salt effect cannot be described in terms of Debye screening, but involves the ion-specific sequestering of anions within the narrow channel. The lifetime of the BPTI decamer is 101 +/- 4 min at 27 degrees C. We propose that the BPTI decamer, with a heparin chain threading the decamer channel, plays a functional role in the mast cell. We also detect a higher oligomer that appears to be a subcritical nucleation cluster of 3-5 decamers. We argue that monomeric crystals form at high pH despite a high decamer population in solution, because the ion pairs that provide the critical decamer-decamer contacts are disrupted at high pH.
Figures


Similar articles
-
The BPTI decamer observed in acidic pH crystal forms pre-exists as a stable species in solution.J Mol Biol. 2000 Mar 31;297(3):697-712. doi: 10.1006/jmbi.2000.3584. J Mol Biol. 2000. PMID: 10731422
-
Decamers observed in the crystals of bovine pancreatic trypsin inhibitor.Acta Crystallogr D Biol Crystallogr. 1999 Jan;55(Pt 1):335-7. doi: 10.1107/S0907444998011068. Epub 1999 Jan 1. Acta Crystallogr D Biol Crystallogr. 1999. PMID: 10089443
-
A pulsed-field gradient NMR study of bovine pancreatic trypsin inhibitor self-association.Biochemistry. 1997 Mar 18;36(11):3383-8. doi: 10.1021/bi9622229. Biochemistry. 1997. PMID: 9116018
-
High-resolution structure of bovine pancreatic trypsin inhibitor with altered binding loop sequence.J Mol Biol. 2000 Feb 4;295(5):1237-49. doi: 10.1006/jmbi.1999.3445. J Mol Biol. 2000. PMID: 10653700
-
Hydrogen exchange rates in proteins from water (1)H transverse magnetic relaxation.J Am Chem Soc. 2002 Sep 4;124(35):10264-5. doi: 10.1021/ja027101c. J Am Chem Soc. 2002. PMID: 12197713
Cited by
-
Supramolecular Phenylalanine-Derived Hydrogels for the Sustained Release of Functional Proteins.ACS Biomater Sci Eng. 2023 Feb 13;9(2):784-796. doi: 10.1021/acsbiomaterials.2c01299. Epub 2023 Jan 24. ACS Biomater Sci Eng. 2023. PMID: 36693219 Free PMC article.
-
Self crowding of globular proteins studied by small-angle x-ray scattering.Biophys J. 2014 Feb 18;106(4):895-904. doi: 10.1016/j.bpj.2013.12.004. Biophys J. 2014. PMID: 24559992 Free PMC article.
-
Isolation and Self-Association Studies of Beta-Lactoglobulin.Int J Mol Sci. 2020 Dec 19;21(24):9711. doi: 10.3390/ijms21249711. Int J Mol Sci. 2020. PMID: 33352705 Free PMC article.
-
Hydrogen exchange mass spectrometry reveals protein interfaces and distant dynamic coupling effects during the reversible self-association of an IgG1 monoclonal antibody.MAbs. 2015;7(3):525-39. doi: 10.1080/19420862.2015.1029217. MAbs. 2015. PMID: 25875351 Free PMC article.
-
Biomolecular hydration: from water dynamics to hydrodynamics.Proc Natl Acad Sci U S A. 2003 Oct 14;100(21):12135-40. doi: 10.1073/pnas.2033320100. Epub 2003 Oct 3. Proc Natl Acad Sci U S A. 2003. PMID: 14528004 Free PMC article.
References
-
- Abragam, A. 1961. The Principles of Nuclear Magnetism. Clarendon Press, Oxford.
-
- Anoardo, E., G. Galli, and G. Ferrante. 2001. Fast field-cycling NMR: applications and instrumentation. Appl. Magn. Reson. 20:365–404.
-
- Beeser, S. A., D. P. Goldenberg, and T. G. Oas. 1997. Enhanced protein flexibility caused by a destabilizing amino acid replacement in BPTI. J. Mol. Biol. 269:154–164. - PubMed
-
- Beil, W. J., M. Schulz, and U. Wefelmeyer. 2000. Mast cell granule composition and tissue location—a close correlation. Histol. Histopathol. 15:937–946. - PubMed
Publication types
MeSH terms
Substances
LinkOut - more resources
Full Text Sources
Other Literature Sources
