Mobility of taxol in microtubule bundles
- PMID: 12770901
- PMCID: PMC1302977
- DOI: 10.1016/S0006-3495(03)75123-6
Mobility of taxol in microtubule bundles
Abstract
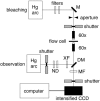
Mobility of taxol inside microtubules was investigated using fluorescence recovery after photobleaching on flow-aligned bundles. Bundles were made of microtubules with either GMPCPP or GTP at the exchangeable site on the tubulin dimer. Recovery times were sensitive to bundle thickness and packing, indicating that taxol molecules are able to move laterally through the bundle. The density of open binding sites along a microtubule was varied by controlling the concentration of taxol in solution for GMPCPP samples. With >63% sites occupied, recovery times were independent of taxol concentration and, therefore, inversely proportional to the microscopic dissociation rate, k(off). It was found that 10k(off)(GMPCPP) approximately equal k(off)(GTP), consistent with, but not fully accounting for, the difference in equilibrium constants for taxol on GMPCPP and GTP microtubules. With <63% sites occupied, recovery times decreased as approximately [Tax](-1/5) for both types of microtubules. We conclude that the diffusion of taxol inside the microtubule bundle is hindered by rebinding events when open sites are within approximately 7 nm of each other.
Figures


Similar articles
-
Thermodynamic and structural analysis of microtubule assembly: the role of GTP hydrolysis.Biophys J. 1997 Mar;72(3):1357-75. doi: 10.1016/S0006-3495(97)78782-4. Biophys J. 1997. PMID: 9138581 Free PMC article.
-
Conformational changes in tubulin in GMPCPP and GDP-taxol microtubules observed by cryoelectron microscopy.J Cell Biol. 2012 Aug 6;198(3):315-22. doi: 10.1083/jcb.201201161. Epub 2012 Jul 30. J Cell Biol. 2012. PMID: 22851320 Free PMC article.
-
Equilibrium studies of a fluorescent paclitaxel derivative binding to microtubules.Biochemistry. 2000 Jan 25;39(3):616-23. doi: 10.1021/bi992044u. Biochemistry. 2000. PMID: 10642187
-
A structural view of microtubule dynamics.Cell Mol Life Sci. 1999 Oct 1;56(1-2):133-42. doi: 10.1007/s000180050012. Cell Mol Life Sci. 1999. PMID: 11213253 Free PMC article. Review.
-
Tubulin rings: which way do they curve?Curr Opin Struct Biol. 2003 Apr;13(2):256-61. doi: 10.1016/s0959-440x(03)00029-0. Curr Opin Struct Biol. 2003. PMID: 12727521 Review.
Cited by
-
Tau induces cooperative Taxol binding to microtubules.Proc Natl Acad Sci U S A. 2004 Aug 31;101(35):12910-5. doi: 10.1073/pnas.0402928101. Epub 2004 Aug 23. Proc Natl Acad Sci U S A. 2004. PMID: 15326286 Free PMC article.
-
Escaping the flatlands: new approaches for studying the dynamic assembly and activation of GPCR signaling complexes.Trends Pharmacol Sci. 2011 Jul;32(7):410-9. doi: 10.1016/j.tips.2011.03.004. Epub 2011 Apr 15. Trends Pharmacol Sci. 2011. PMID: 21497404 Free PMC article. Review.
-
Synthesis and Biological Evaluation of a Biotinylated Paclitaxel With an Extra-Long Chain Spacer Arm.ACS Med Chem Lett. 2012 Sep 13;3(9):745-748. doi: 10.1021/ml300149z. Epub 2012 Jul 30. ACS Med Chem Lett. 2012. PMID: 23259031 Free PMC article.
-
Modeling the yew tree tubulin and a comparison of its interaction with paclitaxel to human tubulin.Pharm Res. 2012 Nov;29(11):3007-21. doi: 10.1007/s11095-012-0829-y. Epub 2012 Jul 26. Pharm Res. 2012. PMID: 22833053
-
A polysaccharide-based hydrogel platform for tumor spheroid production and anticancer drug screening.Sci Rep. 2025 Feb 4;15(1):4213. doi: 10.1038/s41598-025-87896-7. Sci Rep. 2025. PMID: 39905058 Free PMC article.
References
-
- Adam, G., and M. Delbruck. 1968. Reduction of dimensionality in biological diffusion processes. In Structural Chemistry in Molecular Biology. A. Rich and N. Davidson, editors. Freeman, San Francisco. pp. 198–215.
-
- Alberts, B., D. Bray, J. Lewis, M. Raff, K. Roberts, and J. D. Watson. 1994. Molecular Biology of the Cell. Garland Publishing, New York.
-
- Berg, O. G. 1978. On diffusion-controlled dissociation. Chem. Phys. 31:47–57.
-
- Berg, O. G., R. B. Winter, and P. H. Vonhippel. 1981. Diffusion-driven mechanisms of protein translocation on nucleic acids. I. Models and theory. Biochemistry. 20:6929–6948. - PubMed
Publication types
MeSH terms
Substances
LinkOut - more resources
Full Text Sources
Other Literature Sources

