Comparative Study
. 2003 Jun;84(6):3992-4010.
doi: 10.1016/S0006-3495(03)75126-1.

FRET or no FRET: a quantitative comparison

Affiliations
Comparative Study

FRET or no FRET: a quantitative comparison

Claude Berney et al. Biophys J. 2003 Jun.

Abstract

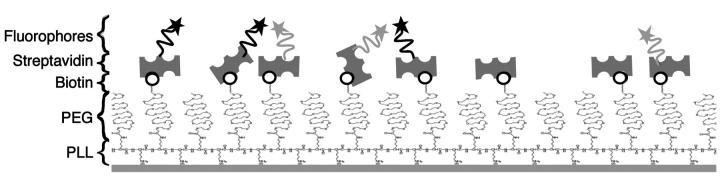
Fluorescence resonance energy transfer (FRET) is a technique used to measure the interaction between two molecules labeled with two different fluorophores (the donor and the acceptor) by the transfer of energy from the excited donor to the acceptor. In biological applications, this technique has become popular to qualitatively map protein-protein interactions, and in biophysical projects it is used as a quantitative measure for distances between a single donor and acceptor molecule. Numerous approaches can be found in the literature to quantify and map FRET, but the measures they provide are often difficult to interpret. We propose here a quantitative comparison of these methods by using a surface FRET system with controlled amounts of donor and acceptor fluorophores and controlled distances between them. We support the system with a Monte Carlo simulation of FRET, which provides reference values for the FRET efficiency under various experimental conditions. We validate a representative set of FRET efficiencies and indices calculated from the different methods with different experimental settings. Finally, we test their sensitivity and draw conclusions for the preparation of FRET experiments in more complex and less-controlled systems.


Figures

FIGURE 1
FIGURE 1
Surface FRET system on a coverslip coated with PLL-g-PEG-biotin. The biotin (black round) is tagged with streptavidin-donor (black star), streptavidin-acceptor (light gray star), and streptavidin-unlabeled.
FIGURE 2
FIGURE 2
FRET efficiency dependence of fluorophore concentrations for different Förster distances. The exciton flux is set to 10 excitations/ns and the integration time to 1000 ns. (A) The fluorophore concentrations are modified via the donor-to-acceptor ratio (RDA) for a 100% labeling (RSA = 1). The dashed lines represent the value of the efficiency for different Förster distances calculated with the single distance model (Eq. 1), where r = Rc, the distance of closest approach (Rc = 5 nm). (B) The fluorophore concentrations are modified via the labeling ratio (RSA) with constant RDA = 1. The Förster distances R0 = 6.31 nm and R0 = 5.55 nm are those of the dye pairs Alexa 488-Alexa 546 and Alexa 488-Alexa 633, respectively. Data for R0 = 2 nm fall almost onto the abscissa of the graph, since Rc (=5 nm) is so much higher that the efficiency does not exceed 0.4%.
FIGURE 3
FIGURE 3
FRET efficiency calculated with five different methods for the dye pair Alexa 488-Alexa 546 (R0 = 6.31 nm). Surface coating parameters have been varied (RDA in A and RSA in B), and results of two experiments are shown as dotted and dashed lines. The black solid line represents the results of the MCS under the same conditions.
FIGURE 4
FIGURE 4
FRET efficiency calculated with four different methods for the dye pair Alexa 488-Alexa 633 (R0 = 5.55 nm). Surface coating parameters have been varied (RDA in A and RSA in B), and results of three experiments are shown as dotted, dashed, and dash-dotted lines. The black solid line represents the results of the MCS under the same conditions.
FIGURE 5
FIGURE 5
Role of the orientation factor χ2 in the simulated efficiency. The new simulated efficiency (dashed line) has been calculated with a random orientation factor. The mean of 10 runs is presented for an experiment where RDA varies (A) and where RSA varies (B). The solid line shows the simulated efficiency with χ2 = ⅔ and the dotted and dash-dotted lines depict experimental efficiencies calculated with method E6 as represented in Fig. 3. Inset, relative occurrence of all classes of χ2 between 0 and 4.
FIGURE 6
FIGURE 6
Relative FRET indices calculated with four different methods for two dye pairs when RDA varies. Results of three experiments for the dye pair Alexa 488-Alexa 546 (panel A, R0 = 6.31 nm) and for the dye pair Alexa 488-Alexa 633 (panel B, R0 = 5.55 nm) are shown as dotted, dashed, and dash-dotted lines. The black solid line represents the results of the MCS under the same conditions.
FIGURE 7
FIGURE 7
Efficiency calculated for an experiment with progressive acceptor bleaching for the dye pair Alexa 488-Alexa 546. (A) False color map of FRET efficiency calculated with method E6 (see Table 1). The range goes from 0 (black) to ∼60% (yellowish green). The squares represent areas where the acceptor was bleached during 1, 5, 10, 15, 20, 25, 50, 75, 100, 200, 300, 500, 750, 1000, 1500, and 2000 cycles (from upper left to lower right). Inset, control experiment with bleaching of the donor alone (blue curve) and with bleaching of the acceptor alone (green curve). (B) FRET efficiency as a function of the bleaching cycle, calculated with method E6 (solid light blue line) and a fit of the curves (dotted light blue line). The relationship between the number of bleach cycles and the mean distance for energy transfer (see text) is illustrated with the black solid line. Inset, relationship between the number of bleaching cycles and RDA (calculated based on the fit curve in B and the interpolated E6 efficiency as a function of RDA taken from Fig. 3 A).
FIGURE 8
FIGURE 8
Error of method E8 due to incomplete photobleaching relative to E6. The error is shown as a function of the fraction of bleached acceptor (solid line) and as a function of the fraction of bleaching cycles (dashed line).
FIGURE 9
FIGURE 9
Relative influence factors as a function of RDA for methods E1 (A), E4 (B), E6 (C), and E7 (D).
FIGURE 10
FIGURE 10
Flow chart of the MCS algorithm. Processes involving the random generator are shown on a gray background.
FIGURE 11
FIGURE 11
Analytical solution for FRET efficiency on a surface. The curve has been calculated for different RDA according to the analytical solution by Wolber and Hudson (1979) with a Förster distance of 6.31 nm and a distance of closest approach of 5 nm (ratio Rc/R0 = 0.79). Results from MCS with the same parameters. Curves generated with exciton fluxes of 1 and 103 excitons/ns delimit the gray area.

Similar articles

Cited by

References

    1. Arai, R., H. Ueda, K. Tsumoto, W. C. Mahoney, I. Kumagai, and T. Nagamune. 2000. Fluorolabeling of antibody variable domains with green fluorescent protein variants: application to an energy transfer-based homogeneous immunoassay. Protein. Eng. 13:369–376. - PubMed
    1. Bottiroli, G., A. C. Croce, and R. Ramponi. 1992. Fluorescence resonance energy transfer imaging as a tool for in situ evaluation of cell morphofunctional characteristics. J. Photochem. Photobiol. B. 12:413–416. - PubMed
    1. Chan, F. K., R. M. Siegel, D. Zacharias, R. Swofford, K. L. Holmes, R. Y. Tsien, and M. J. Lenardo. 2001. Fluorescence resonance energy transfer analysis of cell surface receptor interactions and signaling using spectral variants of the green fluorescent protein. Cytometry. 44:361–368. - PubMed
    1. Clegg, R. 1996. Fluorescence resonance energy transfer. In Fluorescence Imaging Spectroscopy and Microscopy. X. F. Wang and B. Herman, editors. John Wiley, New York. 179–252.
    1. Dale, R. E., J. Eisinger, and W. E. Blumberg. 1979. The orientational freedom of molecular probes. The orientation factor in intramolecular energy transfer. Biophys. J. 26:161–193. - PMC - PubMed

LinkOut - more resources