Isolation of bright aggregate fluctuations in a multipopulation image correlation spectroscopy system using intensity subtraction
- PMID: 12770905
- PMCID: PMC1302981
- DOI: 10.1016/S0006-3495(03)75127-3
Isolation of bright aggregate fluctuations in a multipopulation image correlation spectroscopy system using intensity subtraction
Abstract
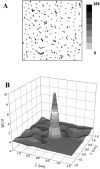
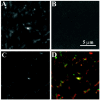
Image correlation spectroscopy allows sensitive measurement of the spatial distribution and aggregation state of fluorescent membrane macro molecules. When studying a single population system (i.e., aggregates of similar brightness), an accurate measure can be made of the aggregate number per observation area, but this measurement becomes much more complex in a distributed population system (i.e., bright and faint aggregates). This article describes an alternate solution that involves extraction of the bright aggregate population information. This novel development for image correlation spectroscopy, termed intensity subtraction analysis, uses sequential uniform intensity subtraction from raw confocal images. Sequential intensity subtraction results in loss of faint aggregate fluctuations that are smaller in magnitude than fluctuations due to the brightest aggregates. The resulting image has correlatable fluctuations originating from only the brightest population, permitting quantification of this population's distribution and further cross-correlation measurements. The feasibility of this technique is demonstrated using fluorescent microsphere images and biological samples. The technique is further used to examine the spatial distribution of a plasma-membrane-labeled fluorescent synthetic ganglioside, and to cross-correlate this probe with various membrane markers. The evidence provided demonstrates that bright aggregates of the fluorescent ganglioside are associated with clathrin-coated pits, membrane microvilli, and detergent-resistant membranes.
Figures


Similar articles
-
Accurate measurements of protein interactions in cells via improved spatial image cross-correlation spectroscopy.Mol Biosyst. 2008 Jun;4(6):672-85. doi: 10.1039/b719826d. Epub 2008 Apr 16. Mol Biosyst. 2008. PMID: 18493666
-
Colocalization analysis in fluorescence micrographs: verification of a more accurate calculation of pearson's correlation coefficient.Microsc Microanal. 2010 Dec;16(6):710-24. doi: 10.1017/S143192761009389X. Epub 2010 Oct 15. Microsc Microanal. 2010. PMID: 20946701
-
Fluorescence correlation spectroscopy for the study of membrane dynamics and protein/lipid interactions.Methods. 2008 Oct;46(2):116-22. doi: 10.1016/j.ymeth.2008.06.011. Epub 2008 Jul 15. Methods. 2008. PMID: 18634881
-
Recent advances in quantitative colocalization analysis: focus on neuroscience.Prog Histochem Cytochem. 2009;44(3):125-72. doi: 10.1016/j.proghi.2009.03.001. Epub 2009 May 8. Prog Histochem Cytochem. 2009. PMID: 19822255 Review.
-
Advances in image correlation spectroscopy: measuring number densities, aggregation states, and dynamics of fluorescently labeled macromolecules in cells.Cell Biochem Biophys. 2007;49(3):141-64. doi: 10.1007/s12013-007-9000-5. Epub 2007 Oct 2. Cell Biochem Biophys. 2007. PMID: 17952641 Review.
Cited by
-
Label-free third harmonic generation imaging and quantification of lipid droplets in live filamentous fungi.Sci Rep. 2022 Nov 5;12(1):18760. doi: 10.1038/s41598-022-23502-4. Sci Rep. 2022. PMID: 36335164 Free PMC article.
-
Paxillin dynamics measured during adhesion assembly and disassembly by correlation spectroscopy.Biophys J. 2008 Apr 1;94(7):2819-31. doi: 10.1529/biophysj.107.104984. Epub 2007 Nov 9. Biophys J. 2008. PMID: 17993500 Free PMC article.
-
Spatiotemporal image correlation spectroscopy (STICS) theory, verification, and application to protein velocity mapping in living CHO cells.Biophys J. 2005 May;88(5):3601-14. doi: 10.1529/biophysj.104.054874. Epub 2005 Feb 18. Biophys J. 2005. PMID: 15722439 Free PMC article.
-
Properties of a self-assembled phospholipid membrane supported on lipobeads.Biophys J. 2004 Jul;87(1):323-31. doi: 10.1529/biophysj.103.030627. Biophys J. 2004. PMID: 15240467 Free PMC article.
-
Quantitating intracellular transport of polyplexes by spatio-temporal image correlation spectroscopy.Proc Natl Acad Sci U S A. 2005 May 24;102(21):7523-8. doi: 10.1073/pnas.0501950102. Epub 2005 May 16. Proc Natl Acad Sci U S A. 2005. PMID: 15897455 Free PMC article.
References
-
- Anderson, R. G., J. L. Goldstein, and M. S. Brown. 1977a. A mutation that impairs the ability of lipoprotein receptors to localise in coated pits on the cell surface of human fibroblasts. Nature. 270:695–699. - PubMed
-
- Anderson, R. G., M. S. Brown, and J. L. Goldstein. 1977b. Role of the coated endocytic vesicle in the uptake of receptor-bound low density lipoprotein in human fibroblasts. Cell. 10:351–364. - PubMed
-
- Brown, C. M., and N. O. Petersen. 1998. An image correlation analysis of the distribution of clathrin associated adaptor protein (AP-2) at the plasma membrane. J. Cell Sci. 111:271–281. - PubMed
-
- Brown, C. M., M. G. Roth, Y. I. Henis, and N. O. Petersen. 1999. An internalization-competent influenza hemagglutinin mutant causes the redistribution of AP-2 to existing coated pits and is colocalized with AP-2 in clathrin free clusters. Biochemistry. 38:15166–15173. - PubMed
Publication types
MeSH terms
Substances
LinkOut - more resources
Full Text Sources

