

Intrasequence GFP in class I MHC molecules, a rigid probe for fluorescence anisotropy measurements of the membrane environment
- PMID: 12770911
- PMCID: PMC1302987
- DOI: 10.1016/S0006-3495(03)75133-9
Intrasequence GFP in class I MHC molecules, a rigid probe for fluorescence anisotropy measurements of the membrane environment
Abstract
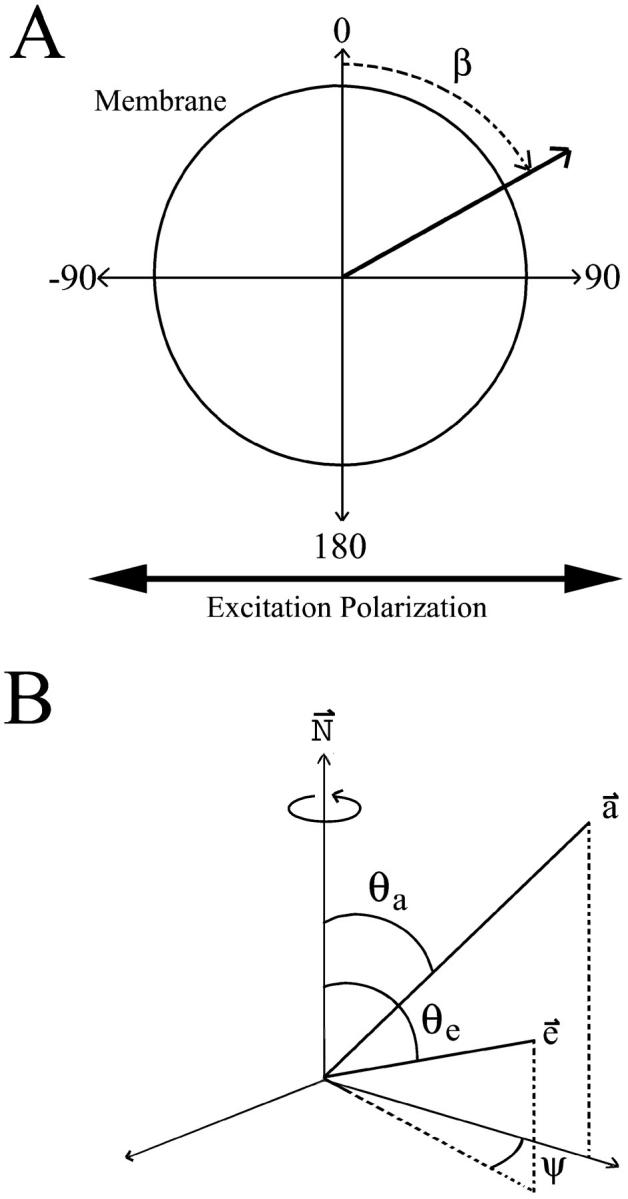
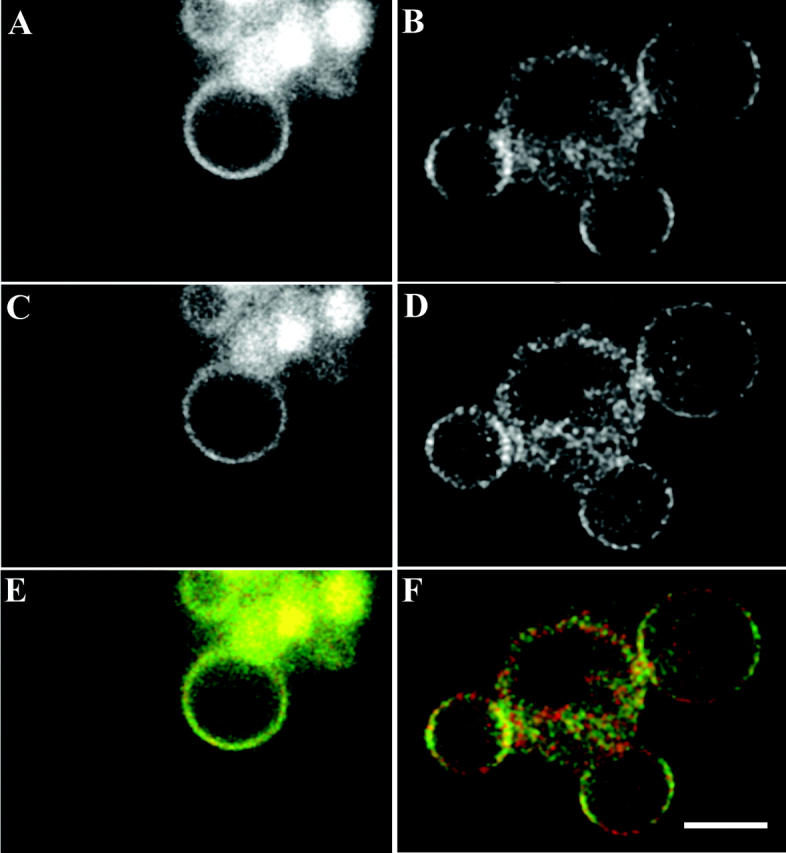
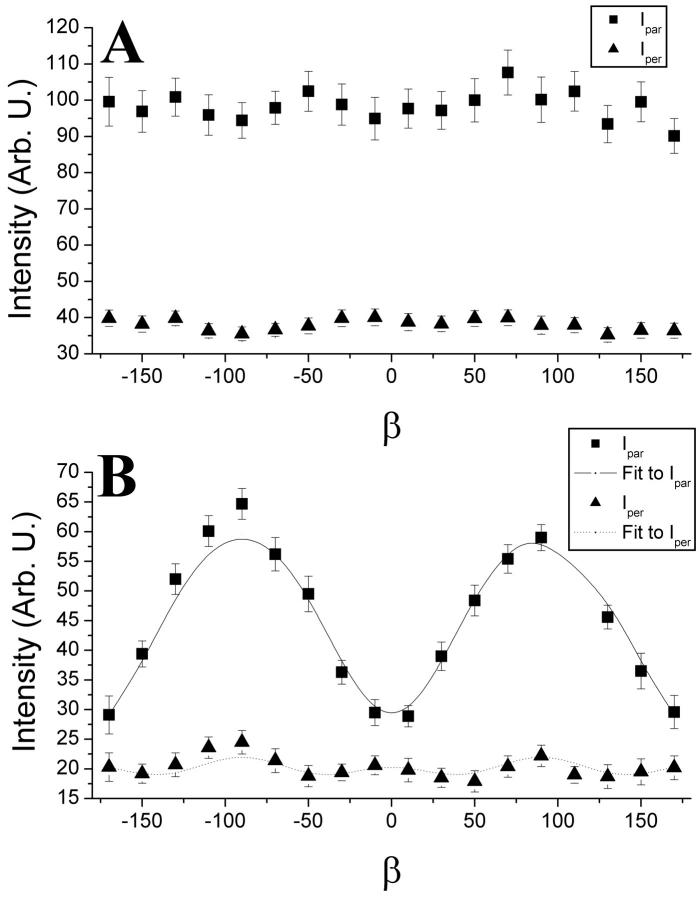
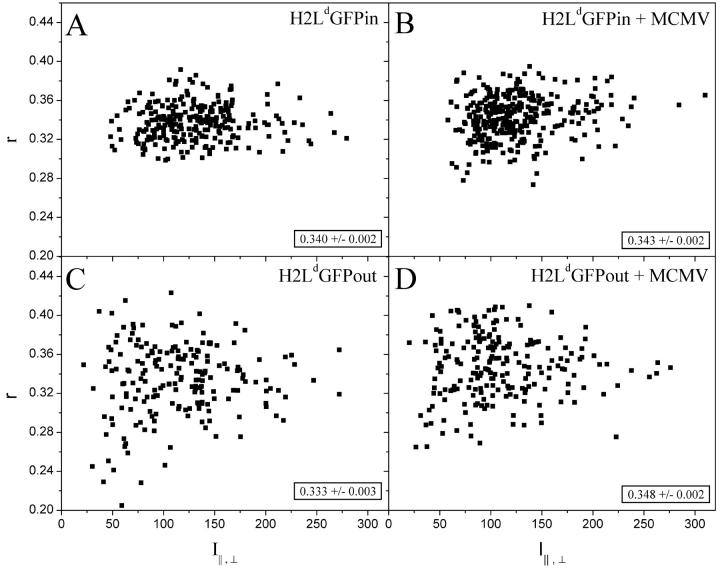
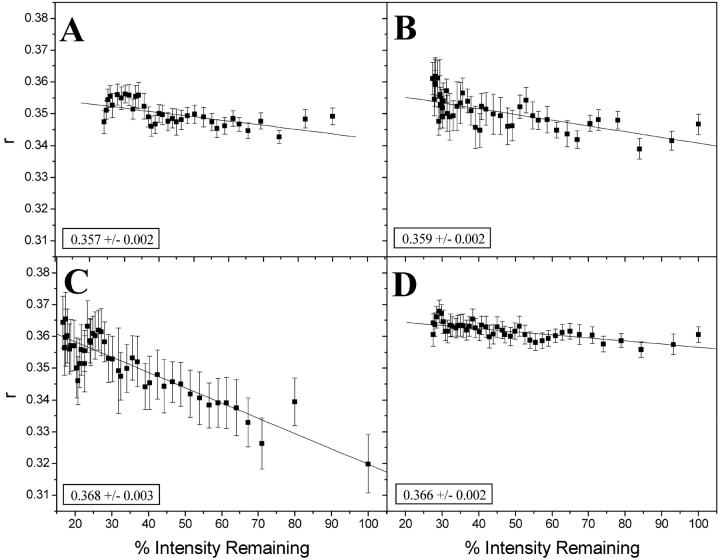
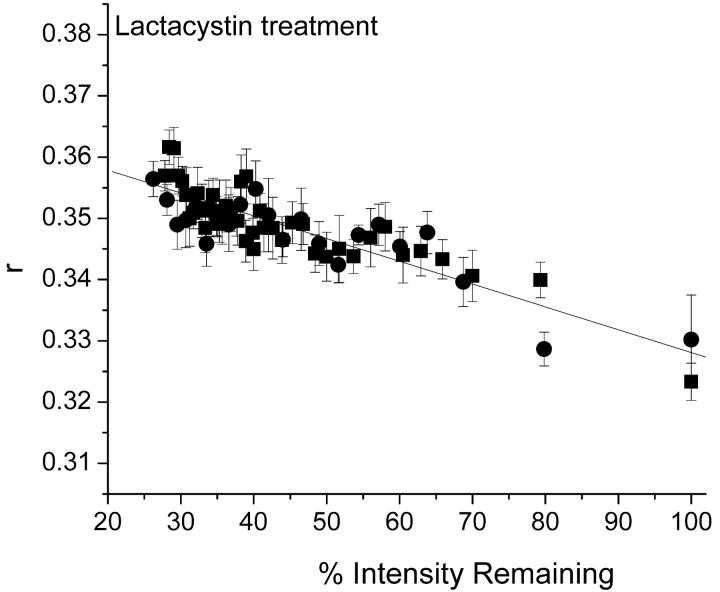
Fluorescence anisotropy measurements can elucidate the microenvironment of a membrane protein in terms of its rotational diffusion, interactions, and proximity to other proteins. However, use of this approach requires a fluorescent probe that is rigidly attached to the protein of interest. Here we describe the use of one such probe, a green fluorescent protein (GFP) expressed and rigidly held within the amino acid sequence of a major histocompatibility complex (MHC) class I molecule, H2L(d). We contrast the anisotropy of this GFP-tagged MHC molecule, H2L(d)GFPout, with that of an H2L(d) that was GFP-tagged at its C-terminus, H2L(d)GFPin. Both molecules fold properly, reach the cell surface, and are recognized by specific antibodies and T-cell receptors. We found that polarized fluorescence images of H2L(d)GFPout in plasma membrane blebs show intensity variations that depend on the relative orientation of the polarizers and the membrane normal, thus demonstrating that the GFP is oriented with respect to the membrane. These variations were not seen for H2L(d)GFPin. Before transport to the membrane surface, MHC class I associates with the transporter associated with antigen processing complex in the endoplasmic reticulum. The intensity-dependent steady-state anisotropy in the ER of H2L(d)GFPout was consistent with FRET homotransfer, which indicates that a significant fraction of these molecules were clustered. After MCMV-peptide loading, which supplies antigenic peptide to the MHC class I releasing it from the antigen processing complex, the anisotropy of H2L(d)GFPout was independent of intensity, suggesting that the MHC proteins were no longer clustered. These results demonstrate the feasibility and usefulness of a GFP moiety rigidly attached to the protein of interest as a probe for molecular motion and proximity in cell membranes.
Figures
Similar articles
-
Time-resolved fluorescence anisotropy and fluctuation correlation analysis of major histocompatibility complex class I proteins in fibroblast cells.Methods. 2014 Mar 15;66(2):283-91. doi: 10.1016/j.ymeth.2013.06.023. Epub 2013 Jun 27. Methods. 2014. PMID: 23811298
-
Measuring rotational diffusion of MHC class I on live cells by polarized FPR.Biophys Chem. 2007 Oct;130(1-2):10-6. doi: 10.1016/j.bpc.2007.06.013. Epub 2007 Jul 6. Biophys Chem. 2007. PMID: 17656002 Free PMC article.
-
Diffusion of green fluorescent protein in the aqueous-phase lumen of endoplasmic reticulum.Biophys J. 1999 May;76(5):2843-51. doi: 10.1016/S0006-3495(99)77438-2. Biophys J. 1999. PMID: 10233100 Free PMC article.
-
Autofluorescent proteins.Methods Cell Biol. 2008;85:1-22. doi: 10.1016/S0091-679X(08)85001-7. Methods Cell Biol. 2008. PMID: 18155456 Review.
-
Fluorescence anisotropy imaging microscopy for homo-FRET in living cells.Methods Cell Biol. 2008;85:395-414. doi: 10.1016/S0091-679X(08)85017-0. Methods Cell Biol. 2008. PMID: 18155472 Review.
Cited by
-
2-Color calcium pump reveals closure of the cytoplasmic headpiece with calcium binding.PLoS One. 2012;7(7):e40369. doi: 10.1371/journal.pone.0040369. Epub 2012 Jul 11. PLoS One. 2012. PMID: 22808146 Free PMC article.
-
Determination of the orientational distribution and orientation factor for transfer between membrane-bound fluorophores using a confocal microscope.Biophys J. 2006 Aug 1;91(3):1032-45. doi: 10.1529/biophysj.106.080713. Epub 2006 May 12. Biophys J. 2006. PMID: 16698772 Free PMC article.
-
Interdomain fluorescence resonance energy transfer in SERCA probed by cyan-fluorescent protein fused to the actuator domain.Biochemistry. 2008 Apr 8;47(14):4246-56. doi: 10.1021/bi702089j. Epub 2008 Mar 14. Biochemistry. 2008. PMID: 18338856 Free PMC article.
-
Optical sensing and control of T cell signaling pathways.Front Physiol. 2024 Jan 10;14:1321996. doi: 10.3389/fphys.2023.1321996. eCollection 2023. Front Physiol. 2024. PMID: 38269062 Free PMC article. Review.
-
Desmoglein 3 Order and Dynamics in Desmosomes Determined by Fluorescence Polarization Microscopy.Biophys J. 2017 Dec 5;113(11):2519-2529. doi: 10.1016/j.bpj.2017.09.028. Biophys J. 2017. PMID: 29212005 Free PMC article.
References
-
- Axelrod, D. 1989. Fluorescence polarization microscopy. Methods Cell Biol. 30:333–352. - PubMed
-
- Bai, A., and J. Forman. 1997. The effect of the proteasome inhibitor lactacystin on the presentation of transporter associated with antigen processing (TAP)-dependent and TAP-independent peptide epitopes by class I molecules. J. Immunol. 159:2139–2146. - PubMed
Publication types
MeSH terms
Substances
Grants and funding
LinkOut - more resources
Full Text Sources
Research Materials
